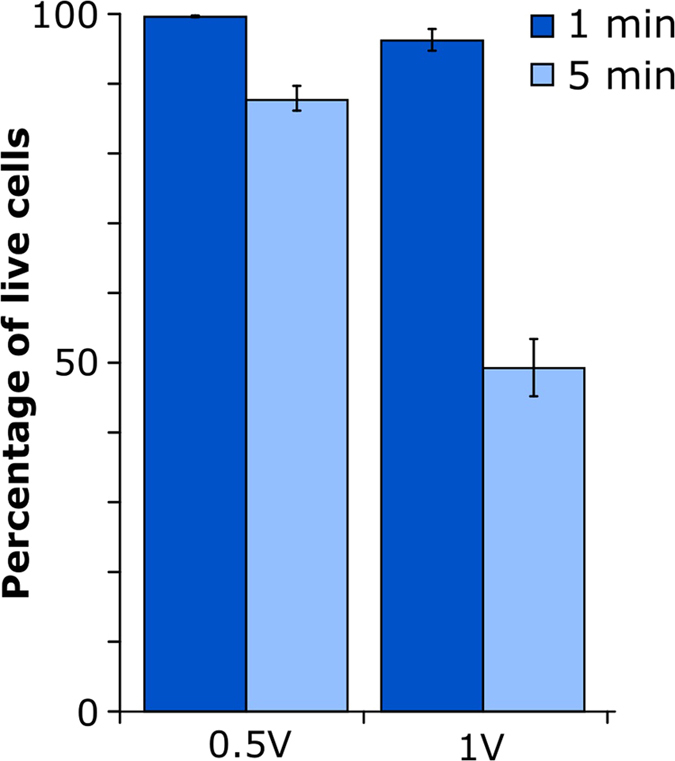
Figure 1. Statistics of cell viability 24 hours after injection with two different voltages and timings.

The ‘injection’ was carried out with nanopipettes (100 nm), loaded only with PBS (i.e. without fluorophores). Approached and inserted into the cytoplasm of single living cells, the pipette was left inside each cell either for 1 min. or 5 min. The applied voltage was set to either 1 V or 500 mV. Afterwards the ‘injected’ cells are observed for 24 hours. The result shows that for 1 min. ‘injection’ time the voltage has no impact on viability with 94% (N = 35) for 1 V and 97% (N = 32) for 500 mV. The original data yields equal or higher viability than the control and hence is considered 100%. After 5 min. however the difference clearly shows. Only 49% (N = 26) of cells treated with 1 V survived the ‘injection’ whereas the viability at 500 mV is almost 30% higher at 85% (N = 17). For experiment details see Table S1.
