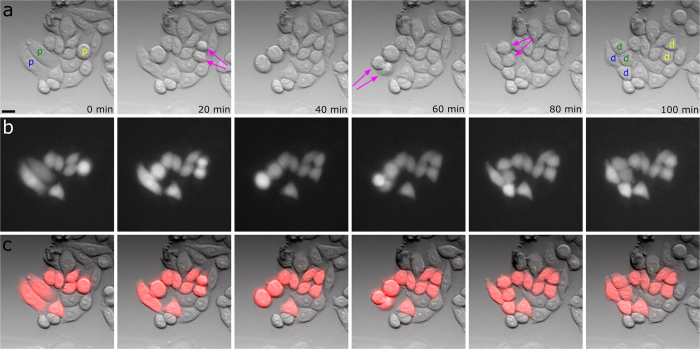
Figure 2. Time-lapse images of living U2OS cells injected with DAF.
(a) Whitelight, (b) wide-field fluorescence and (c) an overlay of both. “p” marks parental cells, the arrows indicate a proliferation event and “d” is for the corresponding daughter cells. Images were acquired every 20 min, using the intensity setting 5% on the DeltaVision Elite at an integration time of 200 ms and 10 ms for the red (632 nm) and whitelight excitation respectively. Scale bar, 20 μm. The full movie can be seen in the Supplementary information (Movie S1).

