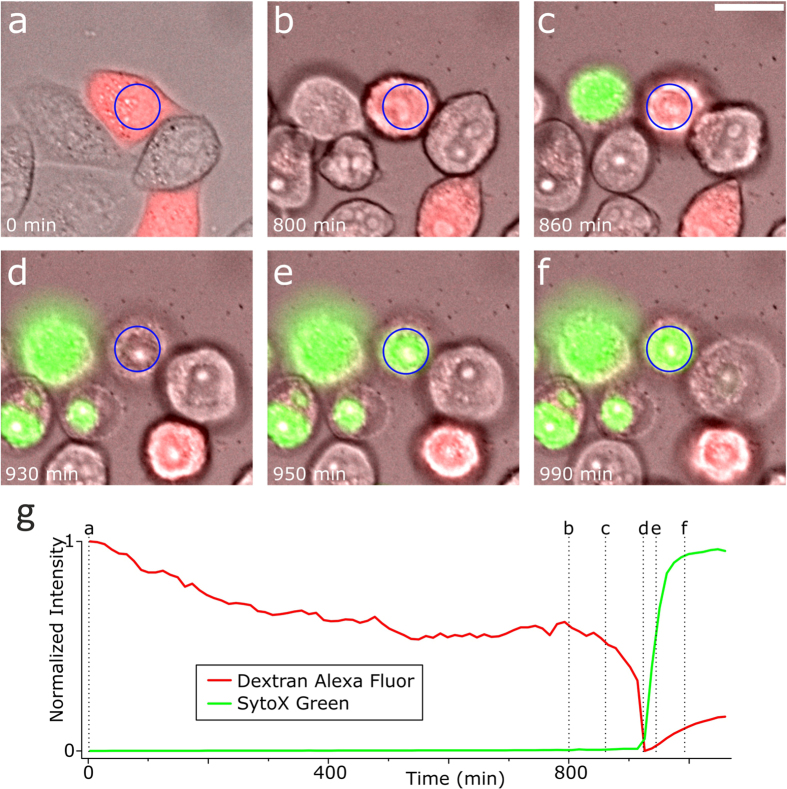
Figure 4. Time-lapse fluorescence-/whitelight-imaging of a cell injected with DAF in a 100 nM SytoX Green Nucleic Acid Stain (SXG) environment.
The cells were kept at 37 °C in culture medium. Both dyes are impermeant to the intact cellular membrane of living cells. DAF does not bind to a specific target inside the cell whereas SXG will label the DNA after entering the cell. (a–f) Overlay of whitelight, green and red fluorescent images of a single dying U2OS cell (blue circle). (a) Healthy cell. The injected DAF is visible within the injected cell (red fluorescence). (b–d) During cell death, the DAF fluorescence will decrease as the DAF molecules leave the cell due to the corrupted cellular membrane. Simultaneously, the SXG molecules begin to enter the cell, indicated by the increased green fluorescence inside the cell. (e,f) The unbound fluorophores diffuse out of the cell while SXG binds to the DNA and creates a strong green fluorescent signal inside the nucleus. (g) Normalized intensities of red and green fluorescence of the area indicated by the blue circle. The decrease in intensity from a) to b) is likely due to photobleaching and the dye being slowly discarded from the cell. Images were acquired every 10 min using the intensity settings 5%, 2% and 5% on the DeltaVision Elite at an integration time of 250 ms, 80 ms and 10 ms for the red (632 nm), green (475 nm) and whitelight excitation respectively. Scale bar, 20 μm.

