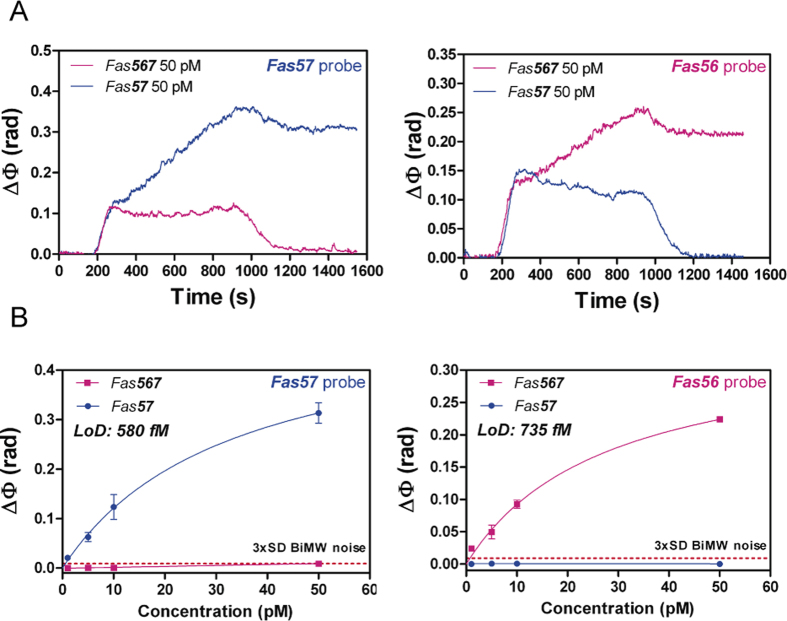
Figure 4. BiMW detection of Fas gene alternative splicing isoforms.
(A) BiMW real-time sensograms of Fas isoforms for Fas57 probe (left) and Fas56 probe (right). (B) BiMW calibration curves for Fas57 probe (left) and Fas56 probe (right). Solid lines (blue and pink) correspond to the non-linear fit of the calibration curves. Red dashed line corresponds to 3xSD BiMW noise, which is the limit for the minimum signal detectable (All data show mean ± SD of triplicate measurements).

