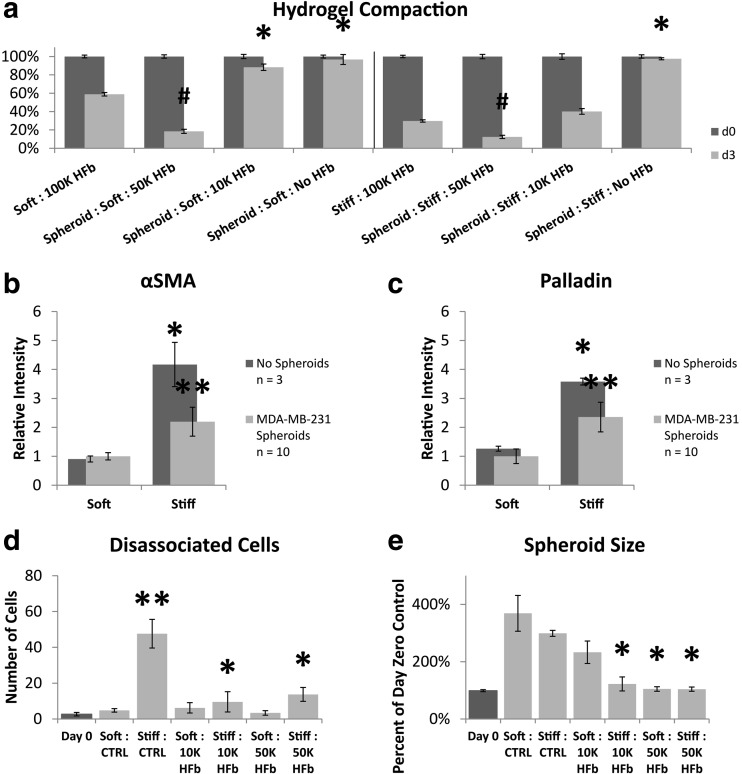
Fig. 3.
Dissemination and spheroid size of MDA-MB-231 spheroids cultured with fibroblasts. a Hydrogel compaction over 3 days. Asterisk indicates significant increase in final size from 100 K; Hash indicates significant decrease in final size from 100 K; Student’s t-test p-value <0.05. b Semi-quantitative immunocytochemistry of αSMA. c Semi-quantitative immunocytochemistry of palladin. Values normalized to soft collagen-I hydrogel with spheroid present. Asterisk indicates significant difference from spheroid in soft gel. Double asterisk indicates significant difference from spheroid in soft gel and no spheroid in stiff gel; Student’s t-test p-value <0.05. d Number of cells which have dissociated from the main tumor spheroid. Asterisk indicates significant difference from day 0; Student’s t-test p-value <0.05. Double asterisk indicates significant difference from day 0; Student’s t-test p-value <0.005. (E) Final size of the tumor spheroid. Asterisk indicates significant difference from day 3 control; Student’s t-test p-value <0.05. Error bars signify standard error of the mean

