Fig. 4.
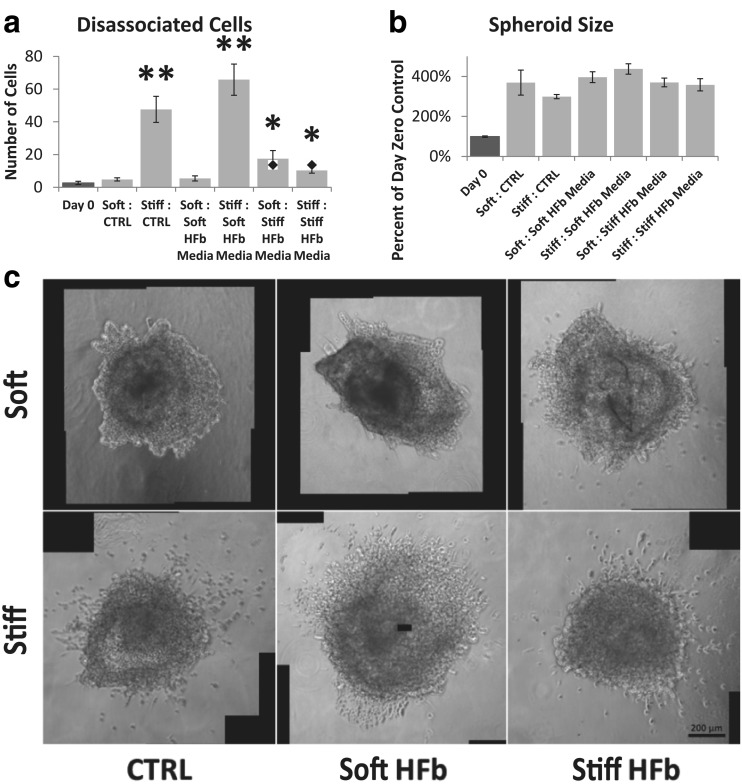
Fibroblast secreted cytokines override stiffness response. a Number of cells which have dissociated from the main tumor spheroid. For reference, diamond in plot is spheroid disassociation with 50 K fibroblasts present in hydrogel (Fig. 3). Asterisk indicates significant difference from day 0; Student’s t-test p-value <0.05. Double asterisk indicates significant difference from day 0; Student’s t-test p-value <0.005. b Final size of the tumor spheroid. There were no statistically significant differences on day 3; Student’s t-test p-value >0.05. c Representative phase contrast images of spheroids on day 3 with conditioned media treatment. Scale Bar =200 μm

