
Figure 2.
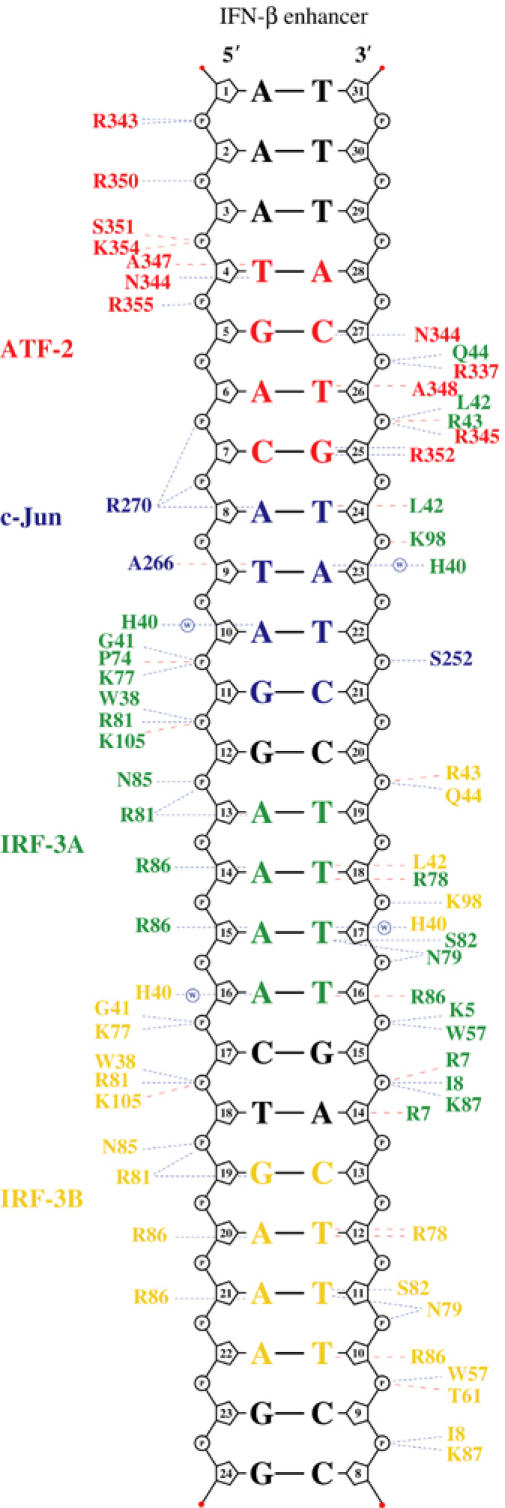
Protein–DNA contacts. Schematic diagram of protein–DNA contacts generated using NUCPLOT (Luscombe et al, 1997). Residues from ATF-2 are in red, c-Jun in blue, IRF-3A in green and IRF-3B in yellow. The core binding sites for each protein are indicated in the corresponding colors. Blue lines indicate hydrogen bonds and red lines van der Waals contacts. Note that contacts by His 40 of IRF-3A and IRF-3B are water mediated.