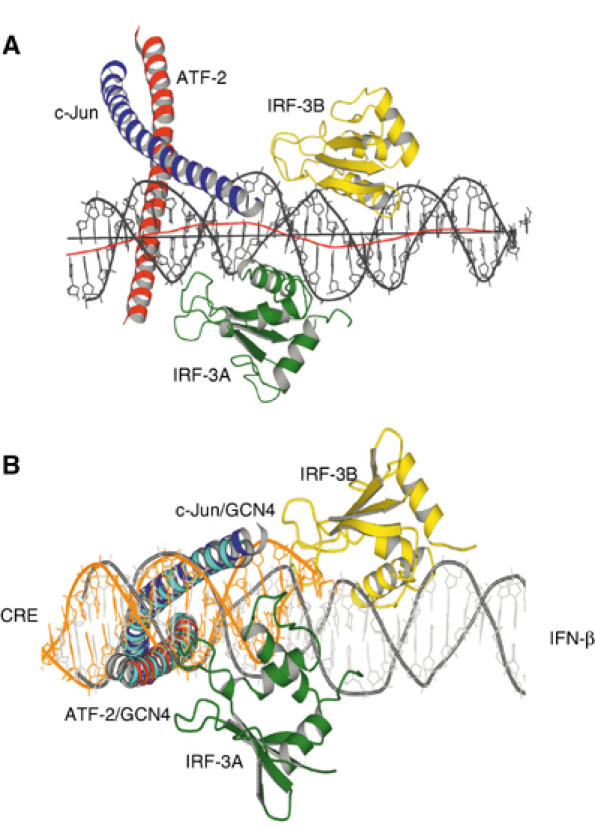
Figure 3.

(A) Side view of the complex showing bending of the DNA around the IRF-3A and IRF-3B domains. The red line shows the local helical axis and the black line a straight overall helical axis fit as calculated with the program Curves (Lavery and Sklenar, 1988). (B) Superposition of Cα residues in the leucine zipper region of ATF-2/c-Jun with those of GCN4 bound to a CRE binding site (1DGC.pdb). The superposed structure is rotated about 90° and viewed from below to reveal the conformational differences in the DNA of the two structures. The GCN4 α helices are shown in cyan and the DNA from the GCN4/CRE complex is shown in orange.
