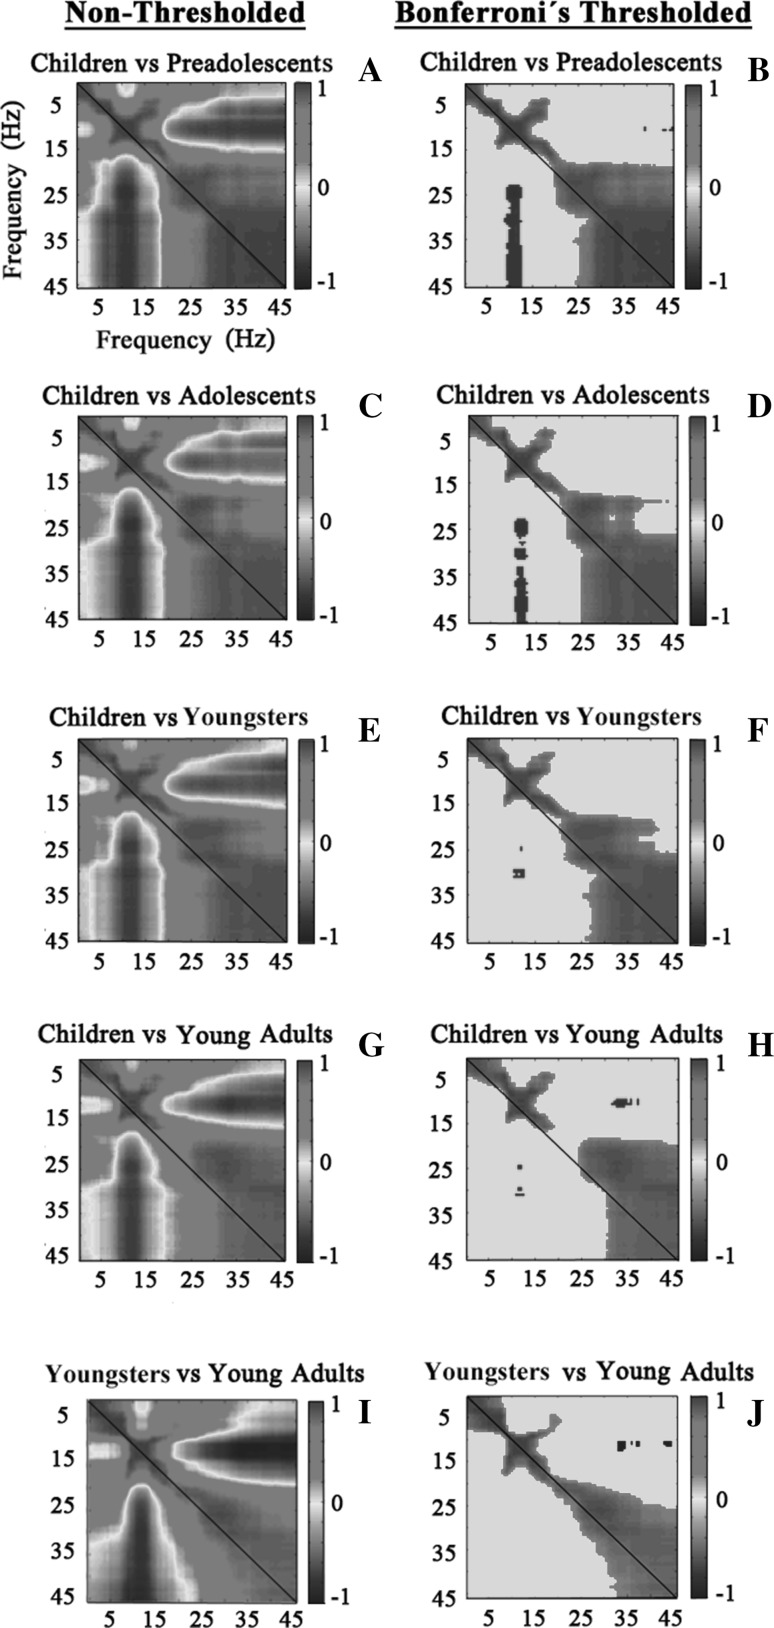
Fig. 5.
Inter-frequency/inter-group spectral power topography correlations between the groups of children and all the other age groups (children: 6–9 years, preadolescents: 10–13 years, adolescents: 14–17 years, youngsters: 18–21 years, young adults: 21–26 years) (a, b, c, d, e, f, g, h), and correlations between young and young adults groups (i, j) for the analyzed frequencies (0.5–45.5 Hz). On the X and Y axes, the frequencies for each comparison group are represented. On the Y axis, the first comparison group is represented, and on the X axis, the second comparison group is represented. The diagonal marks the points at which the maximum correlations should be expected if both correlated age groups have the same SP topography. a, c, e, g, i represent the correlation matrices for non-threshold correlations, and b, d, f, h, j, represent the correlation matrices, applying a threshold based on Bonferroni correction of p values

