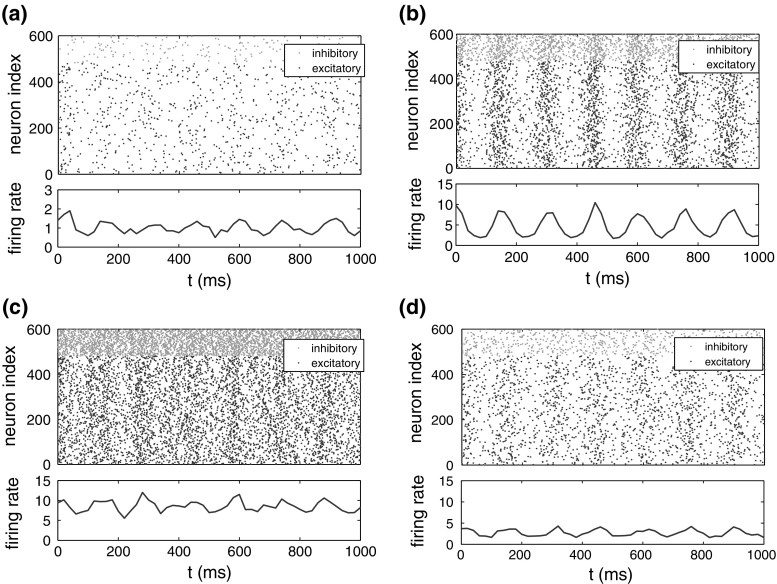
Fig. 1.
Spike raster diagrams and firing rates of the neural network subjected to the same external electric field for different noise intensities of D. Red dots denote inhibitory spikes and blue ones denote excitatory spikes. The frequency of applied field is 6.7 Hz. a ; b ; c ; d , the network is in the decoupled state and subjects to synaptic currents which are recorded without the electric field application before decoupled. (Color figure online)

