Figure 5.

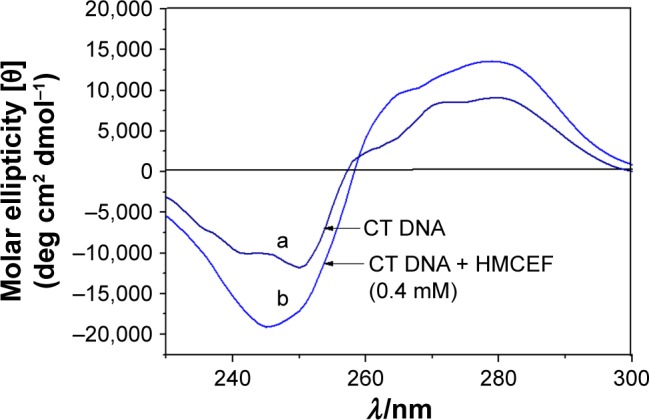
CD spectra of CT DNA in the absence (curve a) and presence of HMCEF (curve b) at (HMCEF)/(CT DNA) value of 2.0.
Abbreviations: CD, circular dichroism; CT DNA, calf thymus DNA; HMCEF, N-(3-hydroxymethyl-β-carboline-1-yl-ethyl-2-yl)-l-Phe.

CD spectra of CT DNA in the absence (curve a) and presence of HMCEF (curve b) at (HMCEF)/(CT DNA) value of 2.0.
Abbreviations: CD, circular dichroism; CT DNA, calf thymus DNA; HMCEF, N-(3-hydroxymethyl-β-carboline-1-yl-ethyl-2-yl)-l-Phe.