Figure 9.
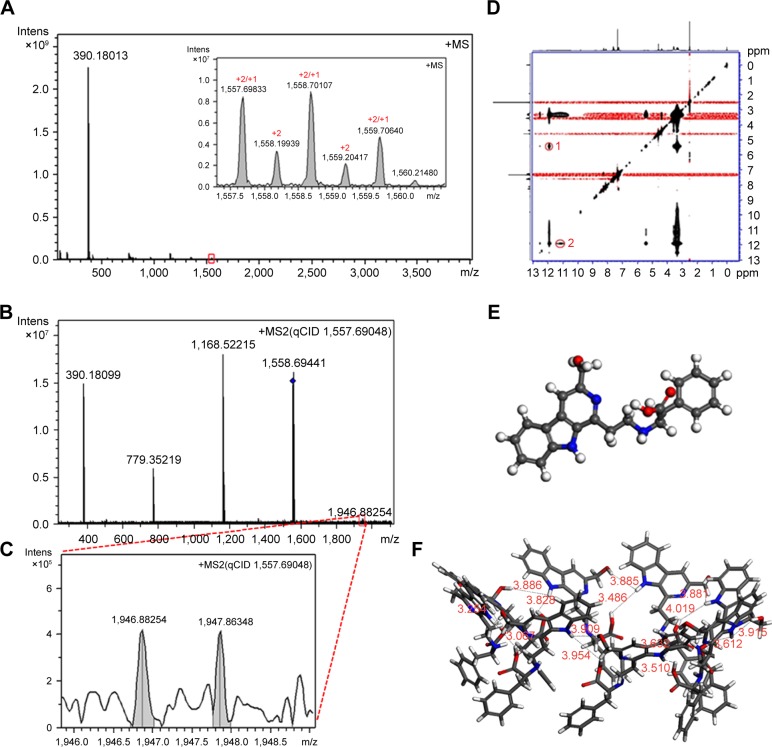
FT-MS, qCID and ROESY 2D NMR spectra, as well as the conformation of HMCEF.
Notes: (A) FT-MS spectrum and the insert of HMCEF give an ion peak of monomer plus H at 390.18013, an ion peak of tetramer plus H at 1,557.69833 and a divalent ion peak of octamer plus H at 1,557.69833. The inset shows magnified area identified by the red square. (B) qCID spectrum of the octamer gives ion peaks of the monomer plus H, the dimer plus H, the trimer plus H, the tetramer plus H and the pentamer plus H. (C) Local amplified spectrum gives an ion peak of the pentamer plus H at 1,946.88254. (D) ROESY 2D NM Rspectrum and two interesting cross-peaks labeled with red circles and named 1 and 2. (E) Energy-minimized conformation of the monomer. (F) Energy-minimized bougarabou-like conformation of the octamer.
Abbreviations: FT-MS, Fourier transform mass spectrometry; HMCEF, N-(3-hydroxymethyl-β-carboline-1-yl-ethyl-2-yl)-l-Phe; Intens, intensity; NMR, nuclear magnetic resonance; qCID, qualitative contingent influence diagram; ROESY, rotating-frame Overhauser effect spectroscopy.

