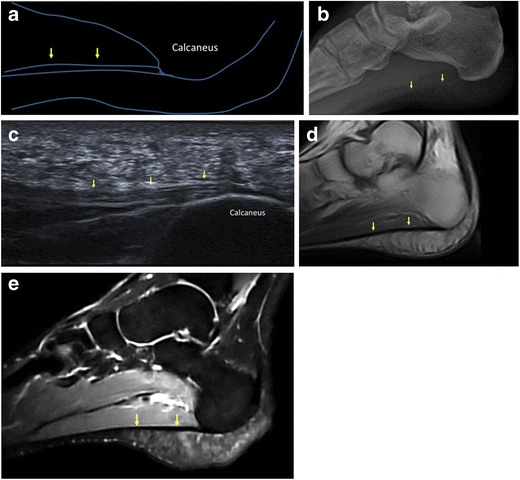
Fig. 1.

Normal plantar fascia. A schematic representation (a) and lateral plain radiograph (b) show the normal PF (arrows). On sagittal ultrasound scan, the normal PF (arrows) appears as a fibrillar ligamentous structure (c). On MRI, the normal PF (arrows) is seen as a thin band of low signal intensity on both T1-weighted (d) and fluid-sensitive (e) images
