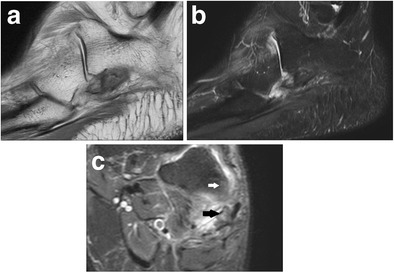
Fig. 9.

POPS – magnetic resonance imaging. 9A T1w image, sagittal plane. 9B T2w fat suppression image, sagittal plane. 9C T2w fat suppression, coronal plane. MRI shows oedema of the bone marrow of the OP (black arrow) and cuboid (white arrow) as well as inflammatory changes in soft tissues
