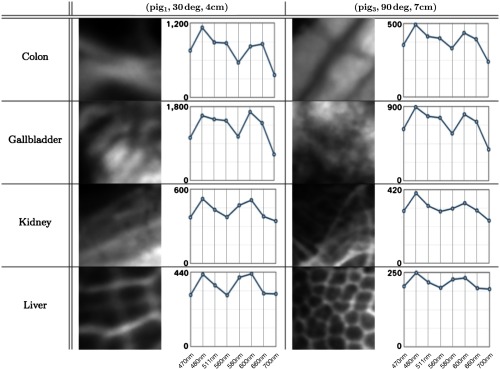
Fig. 4.
Eight patches from two subsets in and the associated AS of each patch. The patches on the left and right side correspond to tissue areas of and , respectively. They had been extracted from the image corresponding to the central wavelength of 470 nm. In each spectrum plot, the -axis denotes the wavelengths (470, 480, 511, 560, 580, 600, 660, and 700 nm) and the -axis denotes the image intensity.

