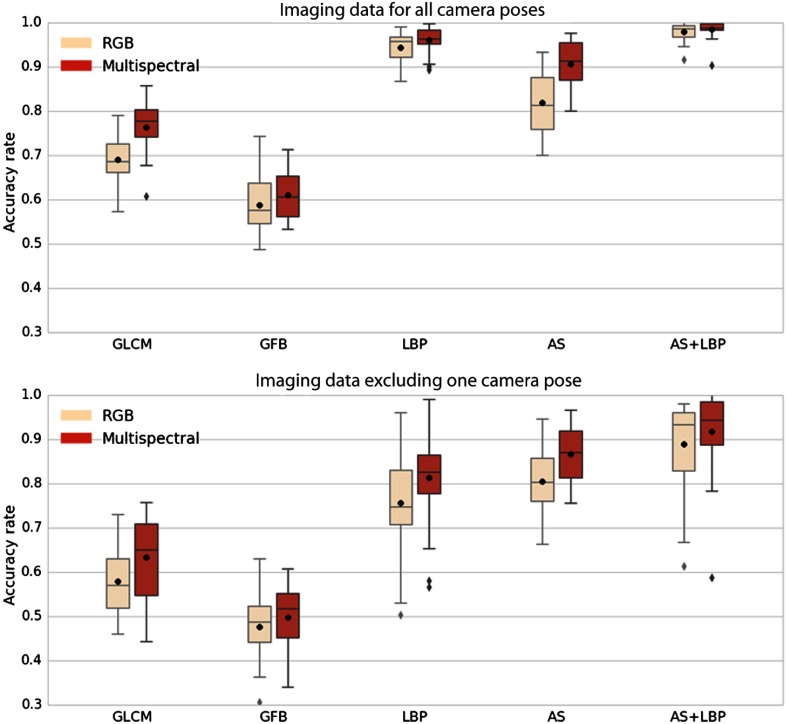
Fig. 5.
Accuracy obtained for different descriptors using RGB data (rose) and eight channels of multispectral data (red). Each box extends from the first quartile to the third quartile. The whiskers denote the range from the fifth percentile to the 95th percentile. Outliers are visualized as well. In each figure, the horizontal axis shows the feature description methods. The vertical axis indicates the accuracy rate. The black point and the bar within each box denote the mean and the median of accuracy rates, respectively. The first row: all camera poses are incorporated in the training set. The second row: the camera pose used in testing set is excluded from the training set.

