
Figure 3.
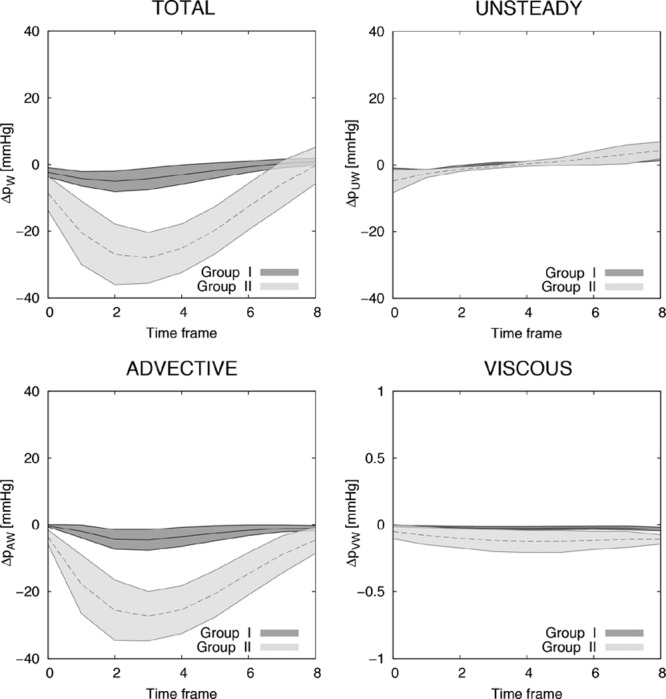
Instantaneous transvalvular pressure drop (TPD) and its components computed for group I (n=20) and group II (n=12) using work–energy relative pressure (WERP) formulation. Each line with range illustrates the mean±SD of the distribution.
Official websites use .gov
A
.gov website belongs to an official
government organization in the United States.
Secure .gov websites use HTTPS
A lock (
) or https:// means you've safely
connected to the .gov website. Share sensitive
information only on official, secure websites.
Instantaneous transvalvular pressure drop (TPD) and its components computed for group I (n=20) and group II (n=12) using work–energy relative pressure (WERP) formulation. Each line with range illustrates the mean±SD of the distribution.