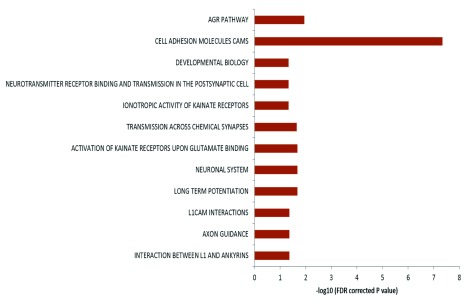
Figure 5. Pathway enrichment analysis of genes harboring somatic variations:
Enrichment of genes harboring somatic variations in brain for pathways related to neuronal function. In the figure the horizontal axis shows the negative logarithm of FDR corrected p-value. Different biological processes are indicated on the left.

