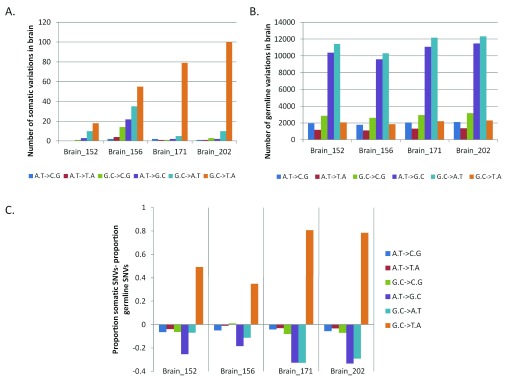
Figure 3. Enrichment of G:C>T:A somatic transversion events in brain.
For each pair of FC-CC samples the absolute numbers of different types of changes are plotted for somatic ( A) and germline variations ( B). ( C) The difference in proportion between somatic SNVs to germline SNVs is plotted for the brain samples. The positive values on the vertical axis denote enrichment of the type of variation in the somatic subset while a negative value indicates enrichment of the type of variation in the germline subset. As evident in the figure only the G:C>T:A transversions show enrichment for the somatic variations in brain.

