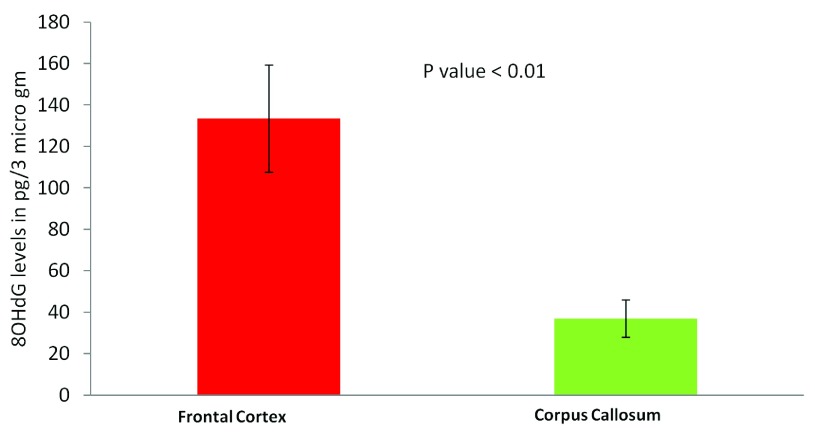
Figure 6. Estimation of 8-OHdG levels in different brain tissues using ELISA:
Frontal cortex samples show significantly higher 8-OHdG accumulation. The figure represents concentration of 8-OHdG in the frontal cortex and corpus callosum samples. For each tissue type five independent samples were analyzed by ELISA. The error bars represent standard deviation (SD for FC, 57.5 and SD for CC, 24.4). The p value is calculated using paired T-test.

