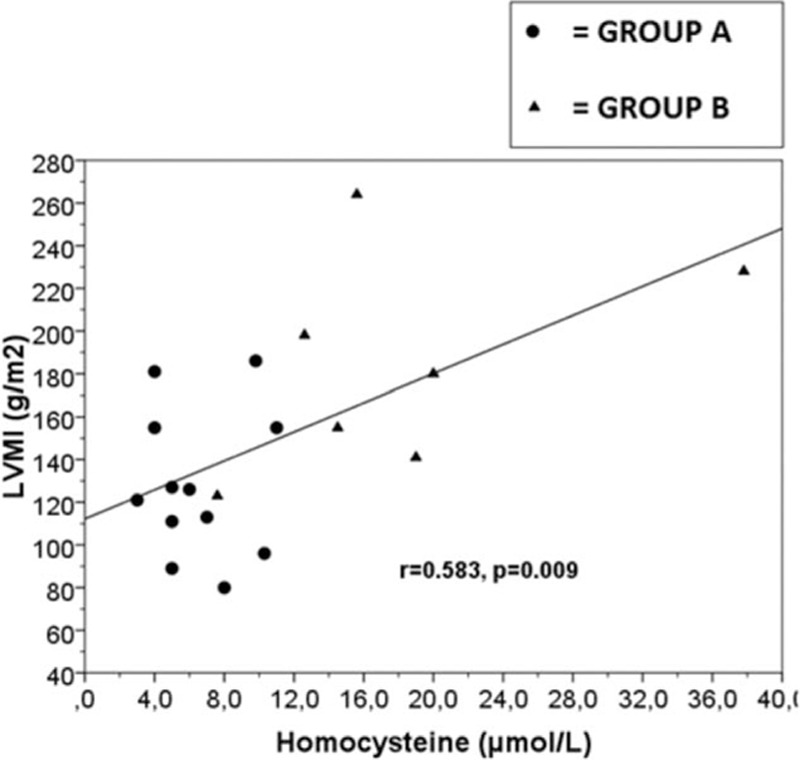
Figure 2.

Linear regression plot. Correlation between LVMI (g/m2) and homocysteine (μmol/L) in ADPKD patients, r = 0.583, P = 0.009. Group A: ADPKD patients with normal plasma aldosterone concentration; Group B: ADPKD patients with primay aldosteronism. ADPKD = autosomal dominant polycystic kidney disease, LVMI = left ventricular mass index.
