
Figure 2.
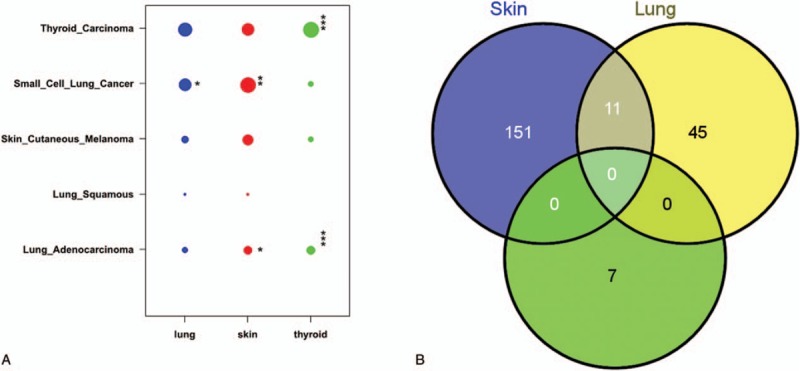
The molecular-based taxonomy and the relationship among the somatic mutations of the 3 tumors. (A) The vertical axis denotes the 5 tumor types and subtypes that we selected from the TCGA database, and the lateral axis indicates the 3 tumor types in our study. The size of the dot indicates the number of genes belonging to a certain tumor type. The Fisher test was performed to investigate the enrichment significance of each dot. The asterisk indicates the P value level: (∗) 0.01–0.05, (∗∗) 0.001–0.01, and (∗∗∗) <0.001. (B) The Venn diagram presents the association of the cancer-related somatic mutations among the 3 tumors. Except for 6 mutations shared between the skin and the lung, no mutation was shared by the 3 tumors.