
Figure 3.
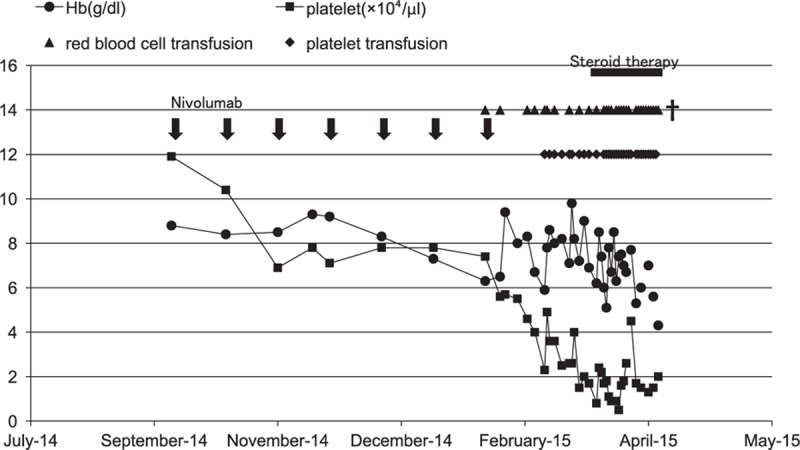
The changes in hemoglobin and platelet counts after nivolumab therapy. Arrows show the administration of nivolumab (2 mg/kg). Closed circles show the hemoglobin level (g/dL). Closed squares show the platelet count (×104 cells/μL). Closed triangles show red blood cell transfusions, with 2 U given each time. Closed diamonds show platelet transfusions, with 10 U given each time. The black column shows steroid therapy.