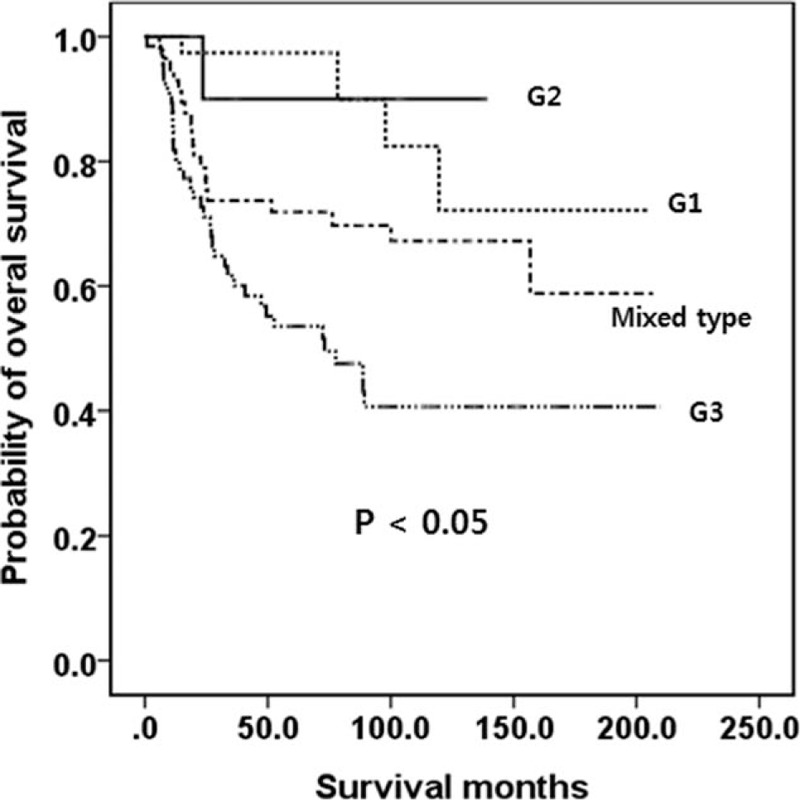
Figure 1.

Kaplan-Meier survival curves of OS in patients with WHO G1 to G3 and mixed-type tumors. Patients with a G3 lesion had a lower OS than patients with G1, G2, or mixed-type tumors. Mixed type had a lower OS than G1 or G2. The OS was similar between G1 and G2. G = grade, OS = overall survival, WHO = World Health Organization.
