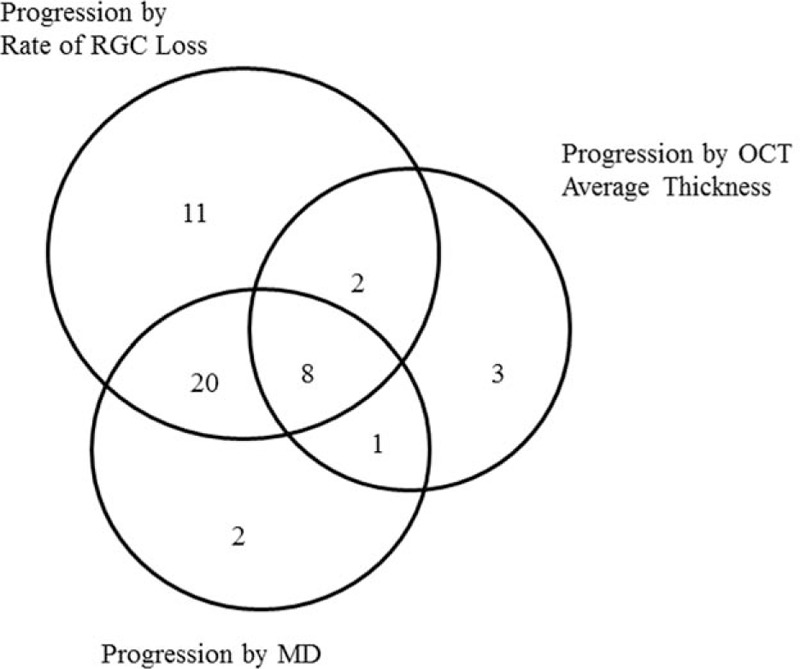
Figure 1.

A Venn diagram comparing the number of eyes detected as progression according to the rate of RGC loss, OCT average thickness parameter, and HFA MD slope. The number of subjects is shown in brackets. HFA = Humphrey Field Analyzer II, MD = mean deviation, OCT = optical coherence tomography, RGC = retinal ganglion cell.
