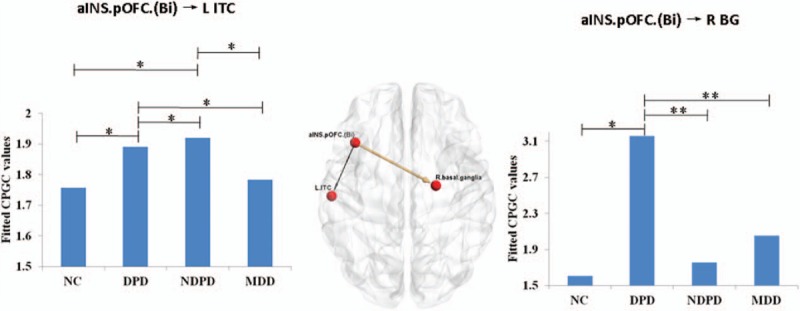
Figure 3.

Two directed pathways which were common in the 3 comparisons of “DPD versus NDPD ”, “DPD versus MDD” and “DPD versus NC ”. The strength of causal connectivity was plotted together with the statistical power. ∗ represents P < 0.05; ∗∗ represents P < 0.01. DPD = depressed Parkinson's disease, MDD = major depressive disorder, NC = normal controls, NDPD = non-depressed Parkinson's disease.
