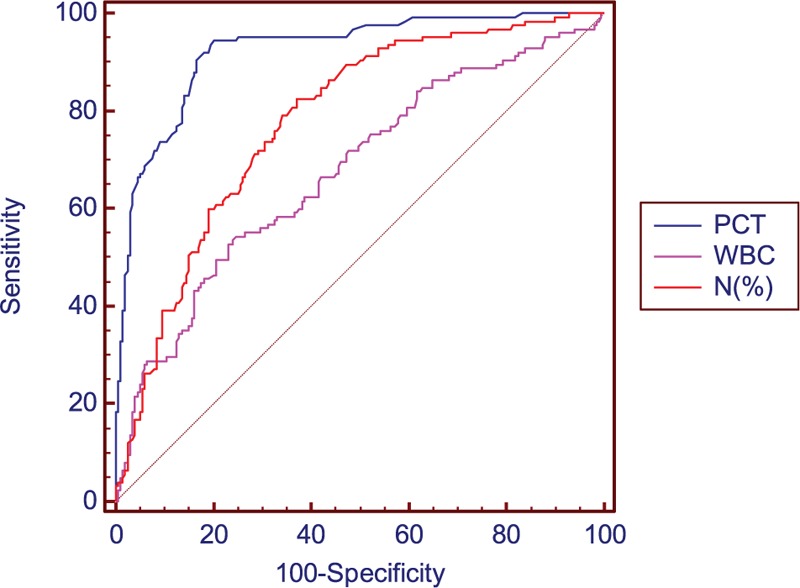
Figure 1.

Receiver operating characteristic (ROC) curves for PCT, WBC, and percentage of neutrophils for diagnosis of infection in patients with chronic liver diseases. Area under curves were 0.923 (95% CI 0.889–0.950), 0.676 (95% CI 0.622–0.727), and 0.778 (95% CI 0.729–0.822) for PCT, WBC, and percentage of neutrophils, respectively. CI = confidence interval, PCT = procalcitonin, ROC = receiver operating characteristic, WBC = white blood cell.
