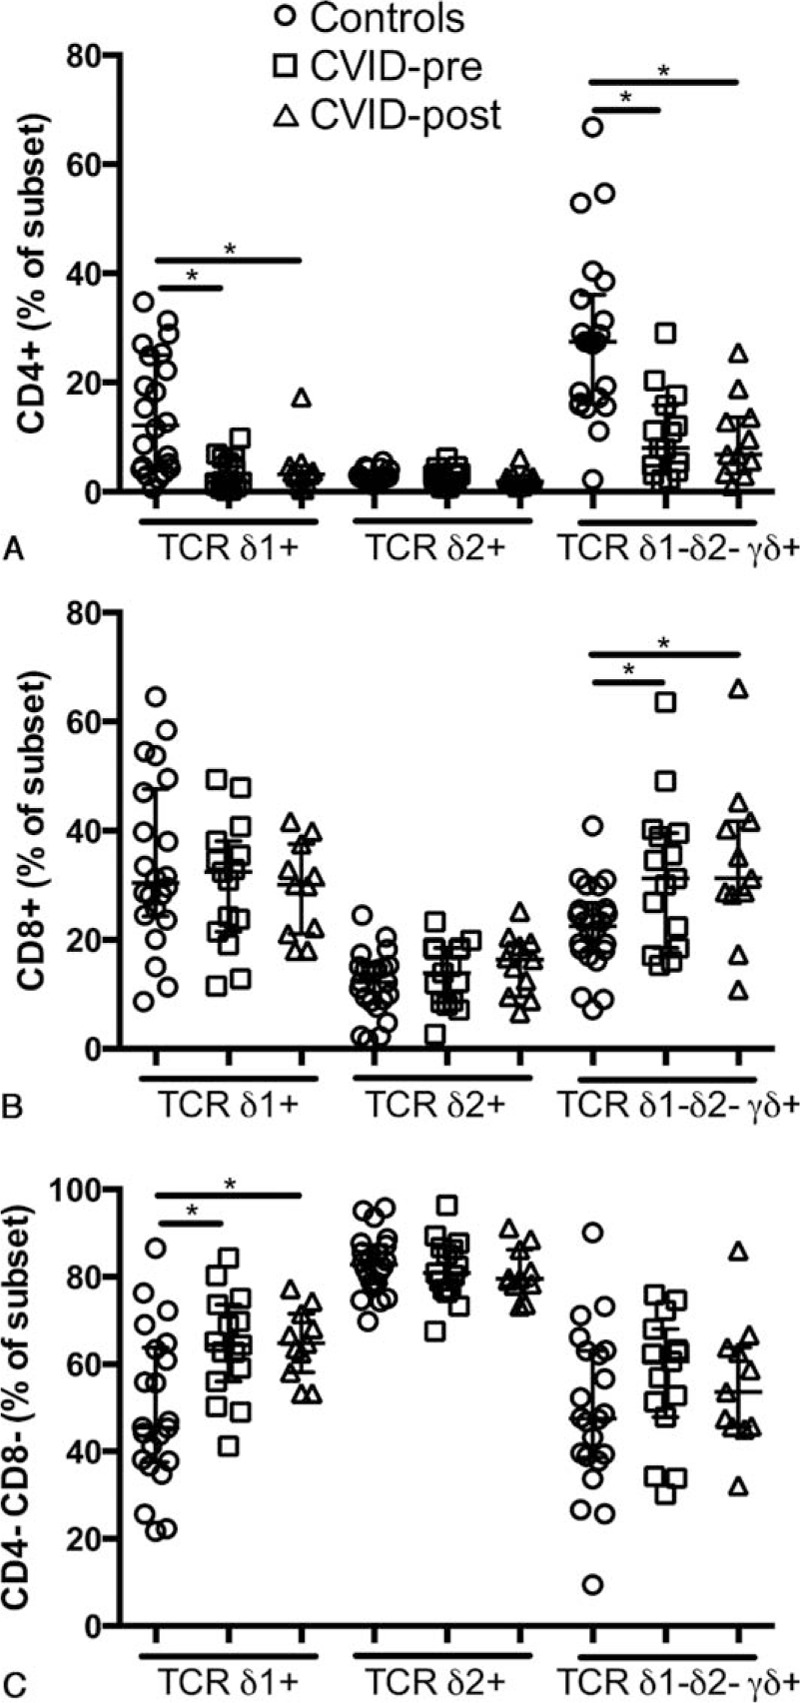
Figure 2.

Altered CD4 and CD8 expression on γδ T cells in CVID. Proportion of γδ+ T cells expressing CD4 (A), CD8 (B), or DN (C) in healthy controls, treatment naive, and IVIg-treated CVID patients. ∗ indicates P <0.05, the lines and whiskers represent the median and interquartile range respectively.
