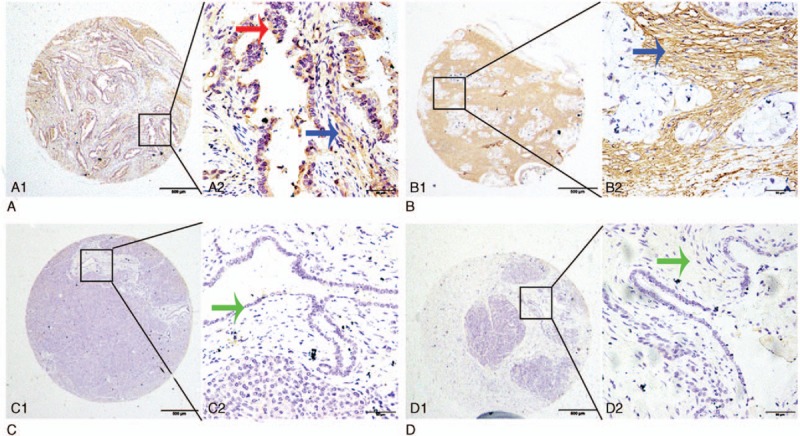
Figure 2.

Representative pattern of GRO-α expression in pancreatic cancer (PC), adjacent noncancerous tissue, and benign pancreatic disease tissues by immunostaining of TMA sections. A1 and A2, Strong positive tumor cytoplasmic immunohistochemical staining (red arrow) and stromal staining (blue arrow) of GRO-α in PC samples. B1 and B2, Strong stromal immunohistochemical staining (blue arrow) of GRO-α in PC samples. C1 and C2, Negative staining for GRO-α in epithelial cells (green arrow) in adjacent noncancerous tissue. D1 and D2, Negative immunohistochemical staining for GRO-α in benign pancreatic stromal cells (green arrow). Original magnification ×40 (bar = 500 μm) in A1, B1, C1, and D1; ×400 (bar = 50 μm) in A2, B2, C2, and D2. GRO-α = growth-regulated oncogene-alpha.
