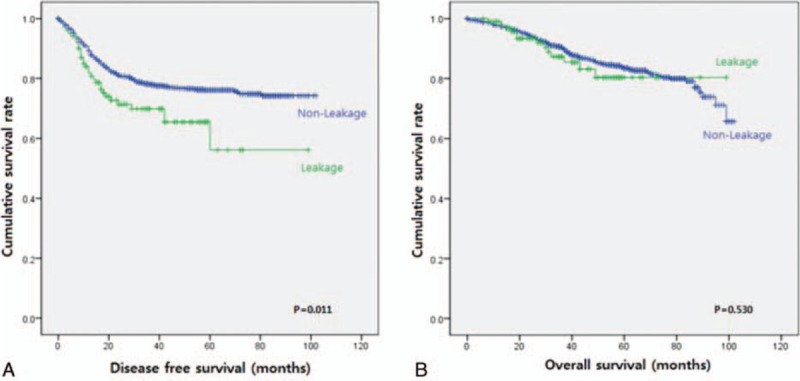
Figure 1.

Kaplan–Meier curve for disease free survival and overall survival in patients with (green line) and without (blue line) anastomotic leakage: A. Comparison of disease free survival between (P = 0.011). B. Comparison of overall survival (P = 0.530).
