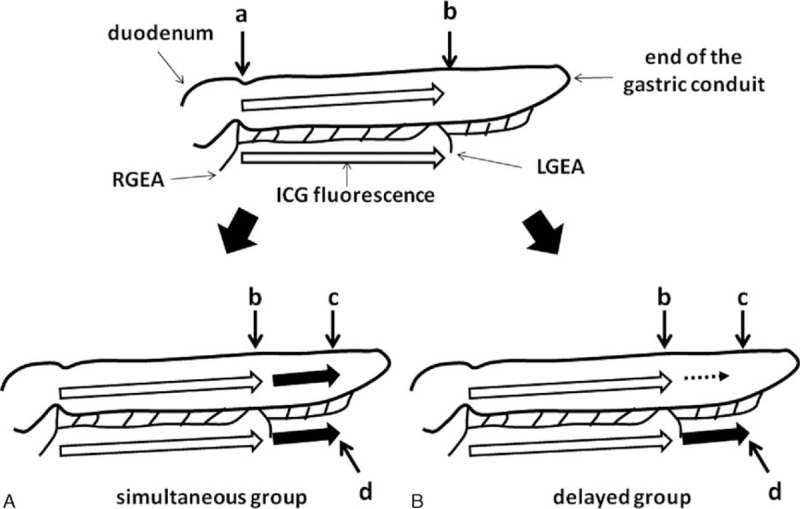
Figure 1.

Schema of the indocyanine green (ICG) fluorescence stream of the gastric conduit. ICG fluorescence stream in the simultaneous group (A) and in the delayed group (B). Point a; ICG fluorescence at the root of right gastroepiploic artery and at the pylorus, point b; ICG fluorescence stream at terminal point of arterial pulsation of the greater curvature, point c; end of ICG fluorescence of the gastric conduit wall, point d; end of ICG fluorescence of the greater curvature vessels. LGEA = left gastroepiploic artery, RGEA = right gastroepiploic artery.
