
Figure 2.
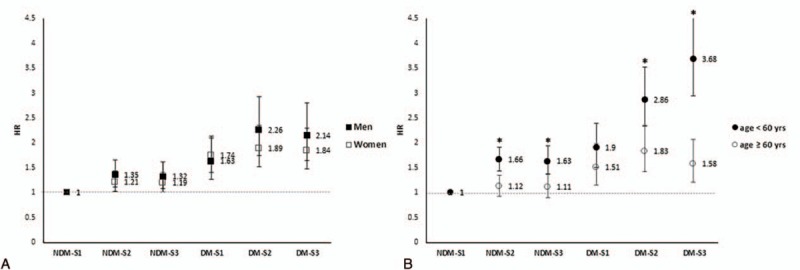
HRs for all-cause mortality according to SES and diabetes, stratified by gender and age (∗P-interaction < 0.01).
Official websites use .gov
A
.gov website belongs to an official
government organization in the United States.
Secure .gov websites use HTTPS
A lock (
) or https:// means you've safely
connected to the .gov website. Share sensitive
information only on official, secure websites.
HRs for all-cause mortality according to SES and diabetes, stratified by gender and age (∗P-interaction < 0.01).