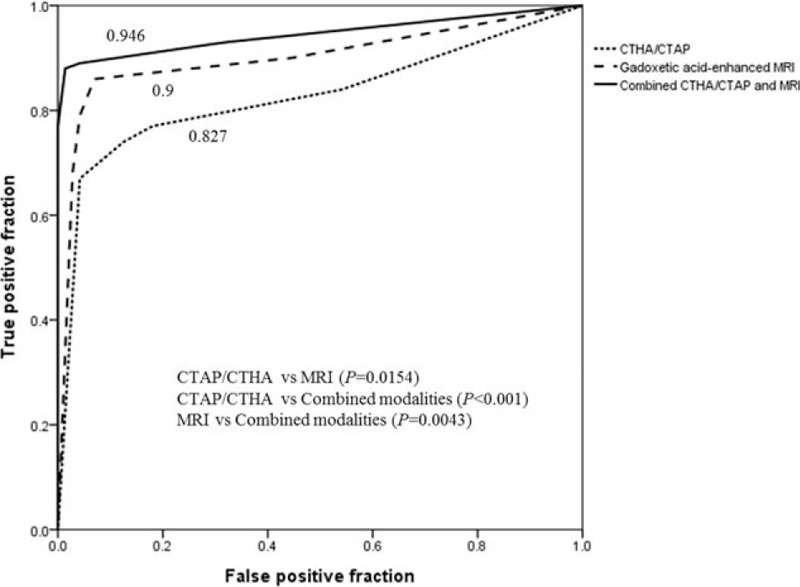
Figure 2.

The graph shows the pooled ROC curves (Az) of two observers for each imaging modality. The pooled Az for detecting HCC by gadoxetic acid-enhanced MRI is 0.9 (95% CI, 0.85–0.951); by CTAP/CTHA, 0.827 (95% CI, 0.763–0.891); and by the combined modalities, 0.946 (95% CI, 0.91–0.982). The differences in pooled Az are statistically significant when each modality is compared with the combined modalities (both, P < 0.005). CI = confidence interval, CTAP/CTHA = computed tomography (CT) during arterial portography/CT during hepatic arteriography, HCC = hepatocellular carcinoma, MRI = magnetic resonance imaging, ROC = receiver operating characteristic.
