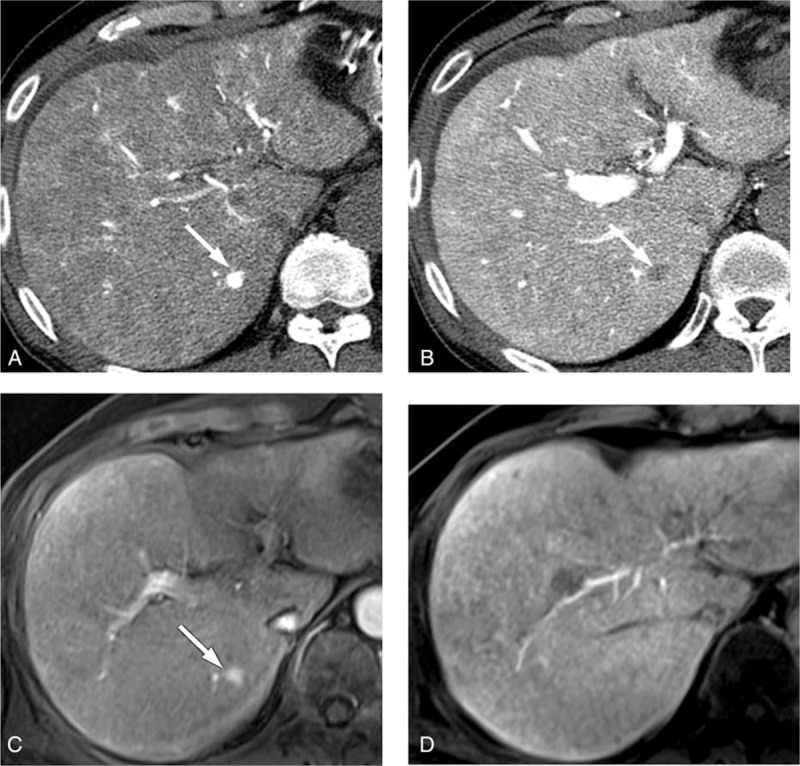
Figure 5.

The CT HA/AP and MR images of a 69-year-old man with a 1 cm arterioportal shunt. The CTHA image shows (A) a hypervascular nodule (arrow) in the early phase and (B) the CTAP image shows a perfusion defect (arrow). The gadoxetic acid-enhanced MR images show (C) a hypervascular nodule (arrow) during the arterial phase, but (D) the lesion is not clearly defined in the hepatobiliary phase. This nodule was interpreted as HCC by both CT HA/AP observers but as a shunt by the MRI observers. CTAP = CT during arterial portography, CTHA = CT during hepatic arteriography, CT HA/AP = computed tomography during hepatic arteriography and arterial portography, HCC = hepatocellular carcinoma, MR = magnetic resonance, MRI = magnetic resonance imaging.
