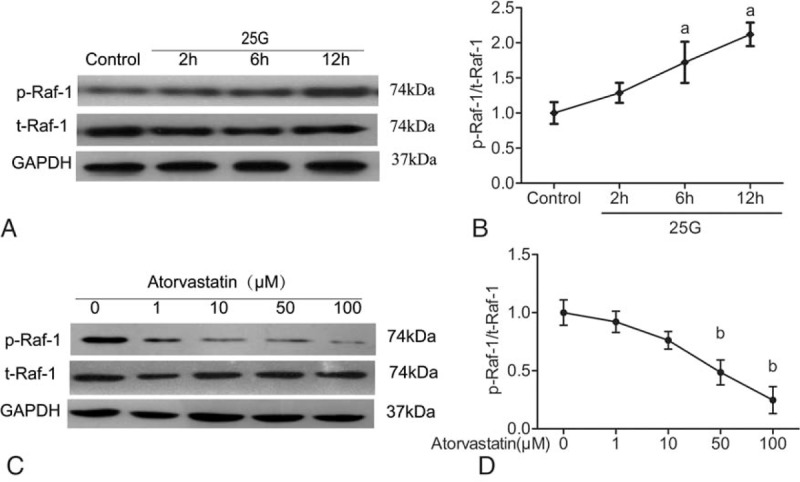
Figure 5.

Effect of high glucose on the Ras complex pathway (Ras/Raf/extracellular signal-regulated kinase/CREB) in INS-1 cells in vitro. (a) INS-1 cells were stimulated with or without 25 mM glucose at different times (1, 2, 6, and 12 hours). Then, phosphorylated and total Raf-1 proteins were harvested and detected by Western blotting (A). (b) The bar graphs show the quantification of the indicated proteins (B). (c) INS-1 cells were pretreated with 25 mM glucose for 6 hours. Subcultures were subjected to different concentrations (1, 10, 50, and 100 μM) of atorvastatin with 25 mM glucose for 24 hours. Then, phosphorylated and total Raf-1 proteins were harvested and detected by Western blotting (C). (d) The bar graphs show the quantification of the indicated proteins (D). aP < 0.01 versus the control group. bP < 0.01 versus the 0 μM atorvastatin group. CREB = cAMP response element-binding protein.
