
Figure 2.
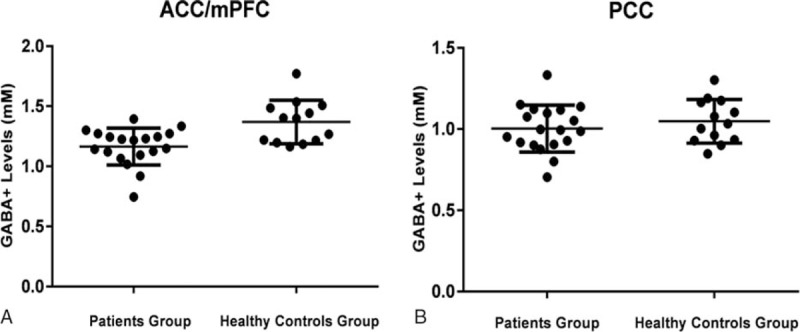
The GABA+ levels of depression patients and healthy control in ACC/mPFC (A) and PCC (B) regions. The mean and standard deviation of GABA+ levels (mM) are displayed. (A) GABA+ levels of patients group are significantly decreased in the ACC/mPFC (P = 0.002). (B) Mean GABA+ levels are lower in patients group than in healthy controls groups in PCC (P = 0.380), but no statistically significant difference is detected. ACC/mPFC = anterior cingulate cortex/medial prefrontal cortex, GABA = gamma-aminobutyric acid, PCC = posterior cingulate cortex.