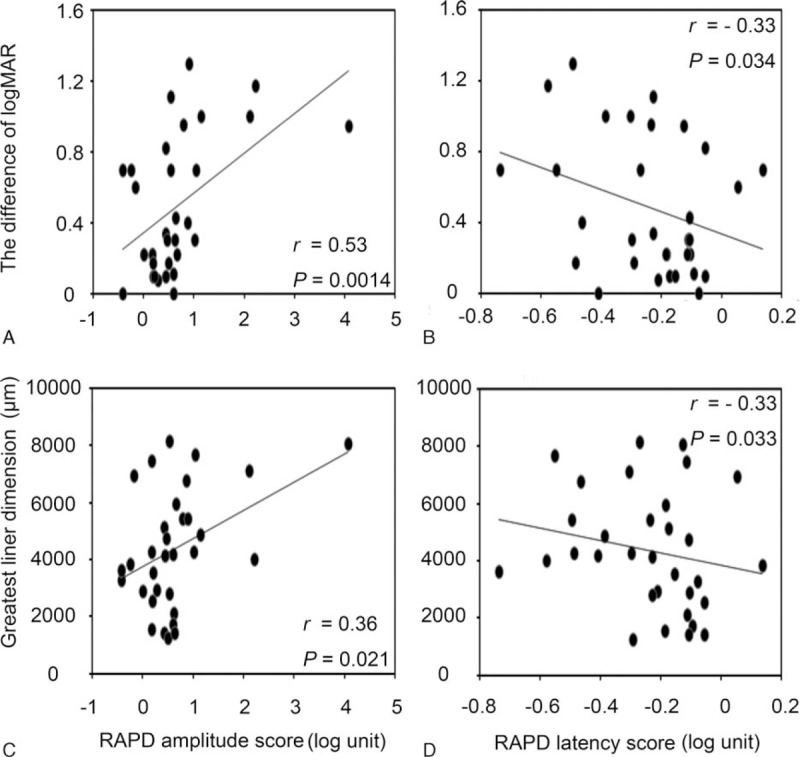
Figure 3.

The correlations between the difference in RAPD score and differences in visual acuity and GLD. Differences in logMAR and GLD were correlated with differences in RAPD amplitude score and in RAPD latency score. GLD = greatest linear dimension, logMAR = logarithm of the minimum angle of resolution, RAPD = relative afferent pupillary defect.
