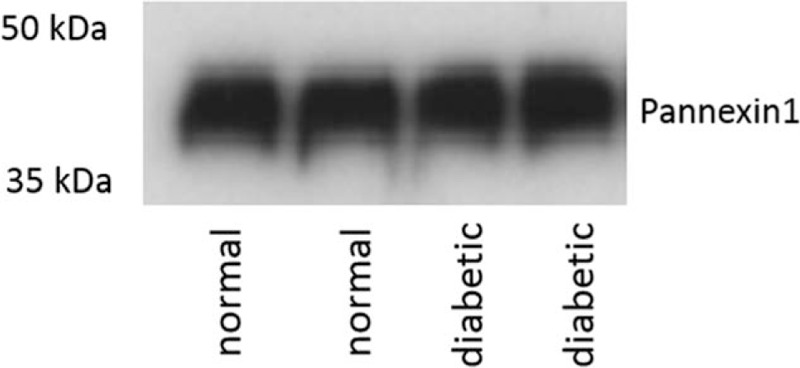
Figure 1.

Total pannexin1 levels unchanged in diabetic as well as control, nondiabetic synaptosomes. Western blot showing unchanged total pannexin1 between diabetic and nondiabetic controls. Two representative lanes are shown for each group, which are pooled samples from 10 cornea samples in each lane.
