
Figure 1.
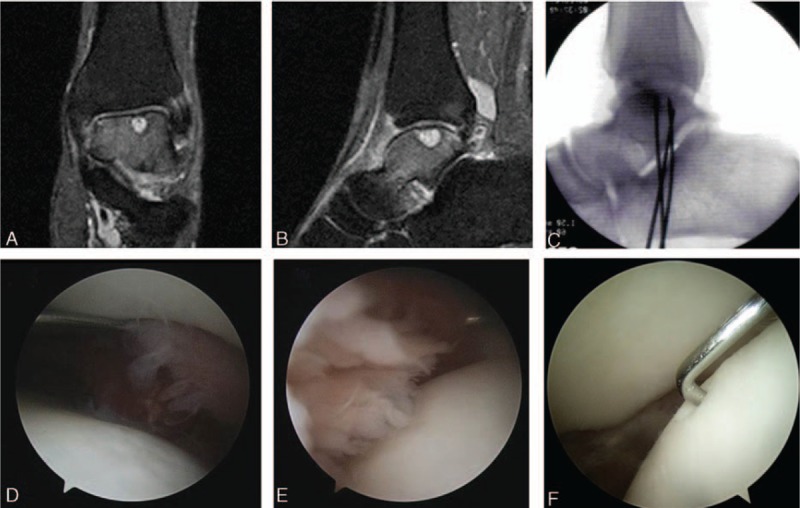
T2-weighted coronal (A) and sagittal (B) magnetic resonance images demonstrating bone marrow edema on talar body and osteochondral lesion with subchondral cyst. Retrograde drilling was performed using K-wires under C-arm image intensifier. (C) Arthroscopic finding showing synovitis surrounding subchondral cyst and relatively intact and stable talar cartilage (D—medial side, E—lateral side, F—central portion).