Figure 1.

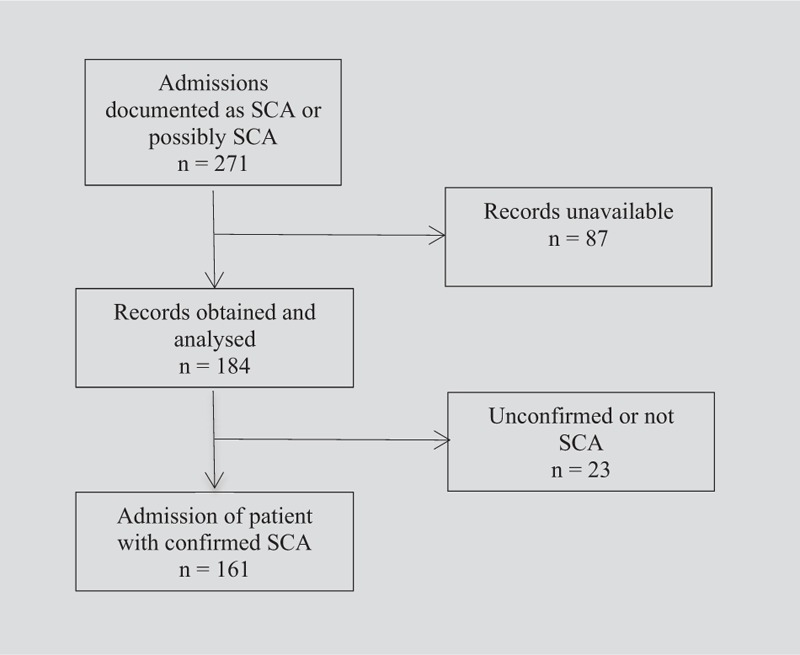
Flow diagram of case identification pathway. Vertical arrows indicate the flow of patients included in the data analysis; horizontal arrows indicate the patients who were excluded.

Flow diagram of case identification pathway. Vertical arrows indicate the flow of patients included in the data analysis; horizontal arrows indicate the patients who were excluded.