
Figure 4.
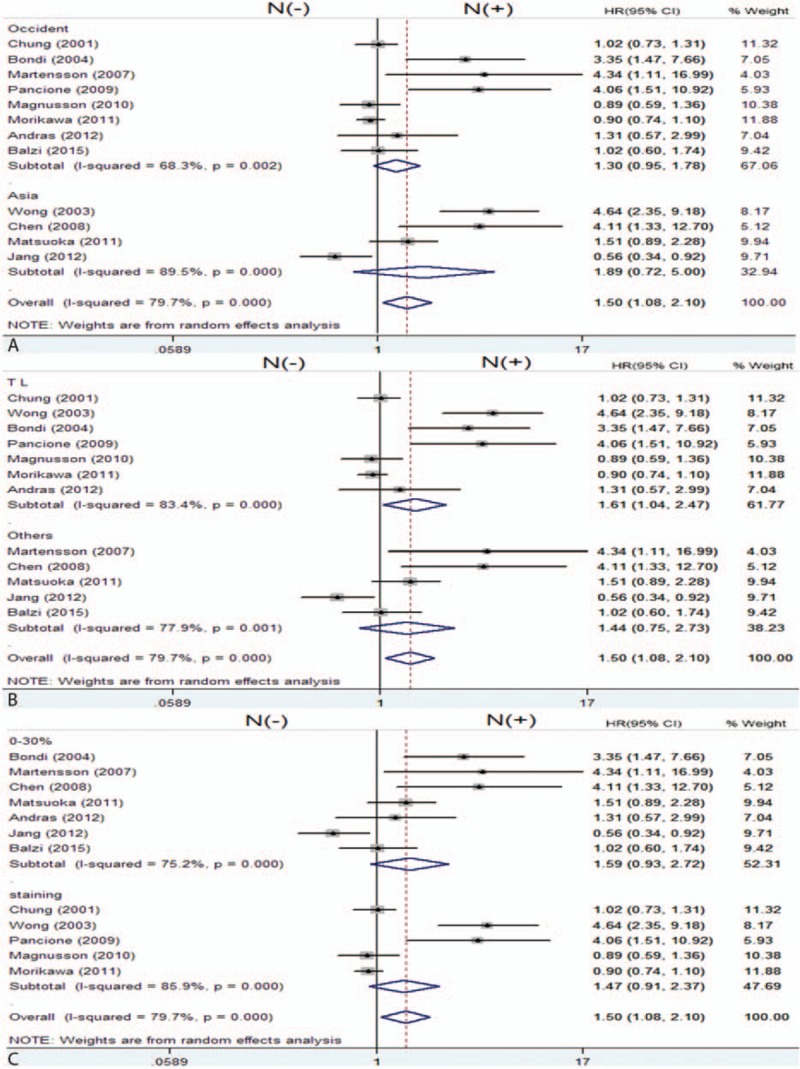
Forest plot of hazard ratio for the association of β-catenin expression in the nucleus with OS by subgroup analysis by study location (A), primary antibody sources (B), and evaluation standards (C). (N (−): β-catenin negative expression in the nucleus; N (+): β-catenin overexpression in the nucleus). OS = overall survival.