
Figure 2.
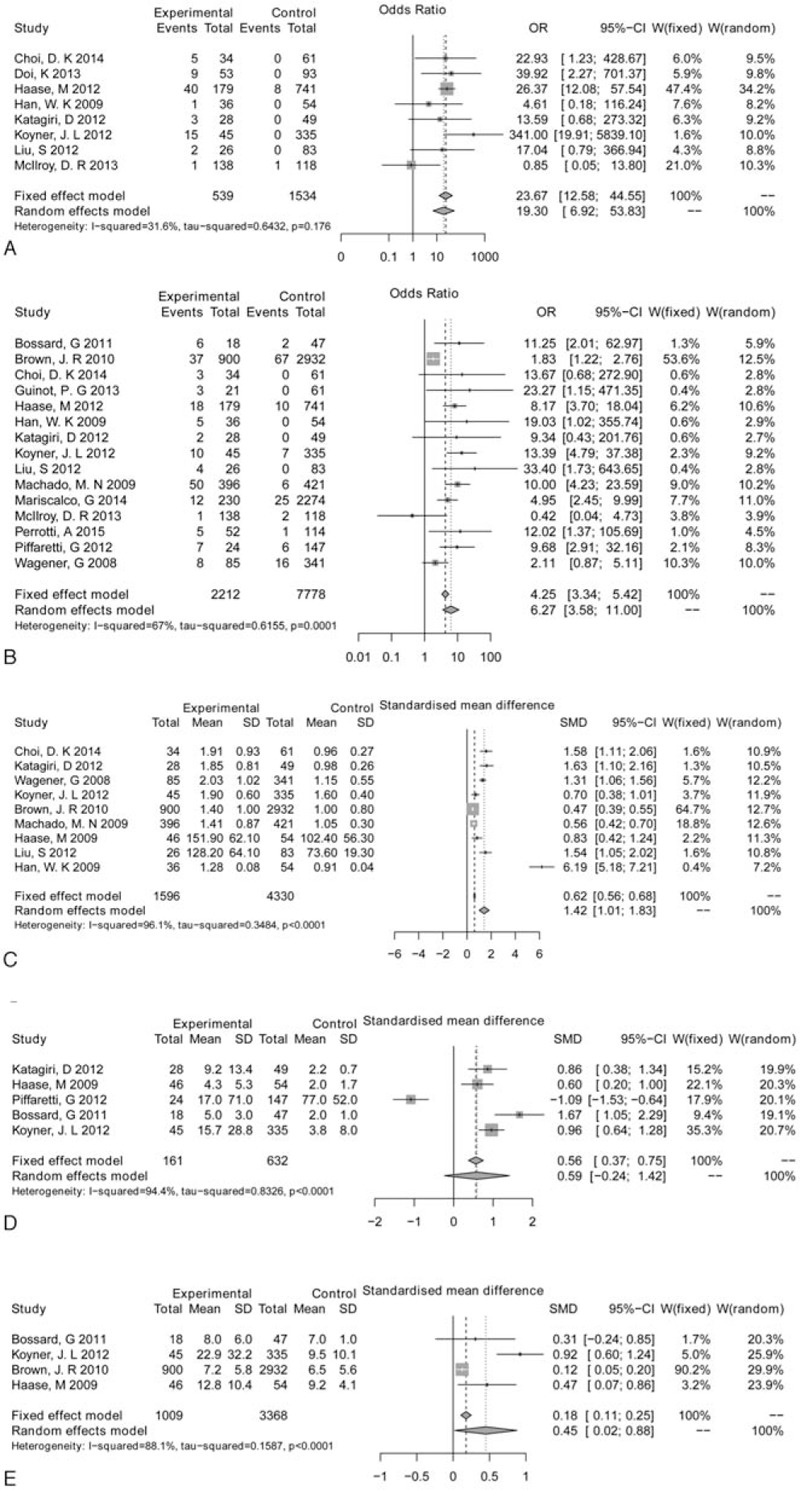
Forest plot of renal replacement therapy (RRT) (A), mortality (B), serum creatinine (C), intensive care unit (ICU) stay (D), and hospital length of stay (LOS) (E).ICU = intensive care unit, LOS = length of stay, RRT = renal replacement therapy.