
Figure 2.
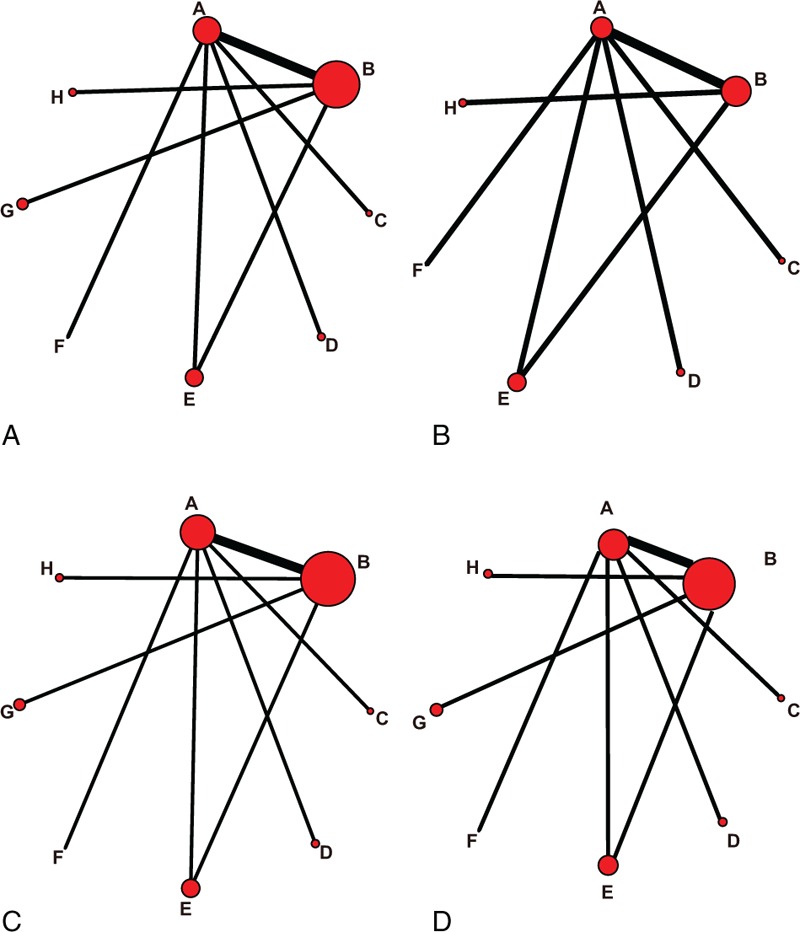
Network plot of the 7 targeted drugs. Nodes and lines are weighted according to the number of studies providing direct comparisons between 2 treatments. Nodes are weighted according to the number of studies including the respective interventions. Edges are weighted according to the inverse of variance. ([A] SD and DCR; [B] PD; [C] CR, PR and ORR; [D] OS; A: placebo; B: sorafenib; C: ramucirumab; D: everolimus; E: brivanib; F: tivantinib; G: sunitinib; H: sorafenib + erlotinib; ORR: CR + PR; DCR = SD + CR + PR). CR = complete response, DCR = disease control rate, OR = odds ratio, ORR = overall response ratio, OS = overall survival, PD = progressive disease, PR = partial response, SD = stable disease.