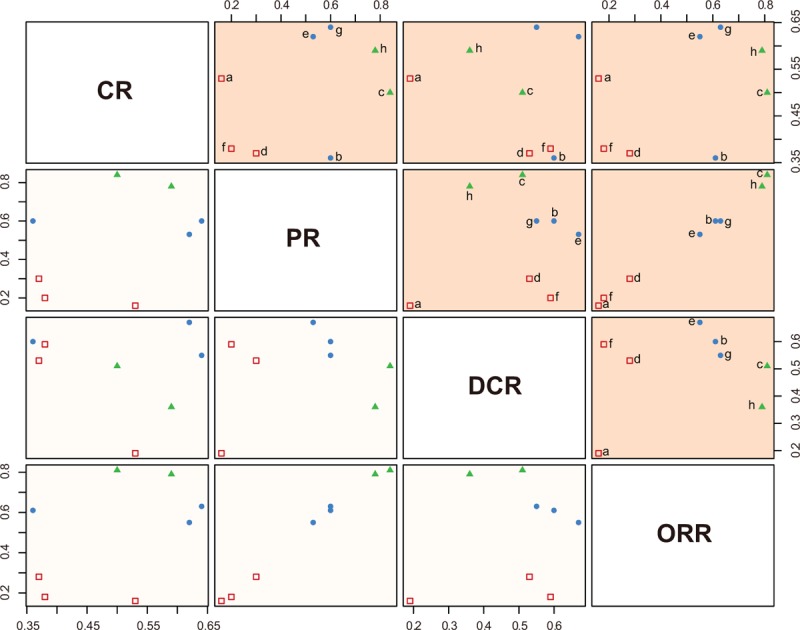
Figure 7.

Clustered ranking plots based on SUCRA values of 4 outcomes. (a: placebo; b: sorafenib; c: ramucirumab; d: everolimus; e: brivanib; f: tivantinib; g: sunitinib; h: sorafenib + erlotinib; CR; PR; DCR; ORR; ORR: CR + PR; DCR = SD + CR + PR). CR = complete response, DCR = disease control rate, ORR = overall response ratio, PD = progressive disease, PR = partial response, SD = stable disease.
