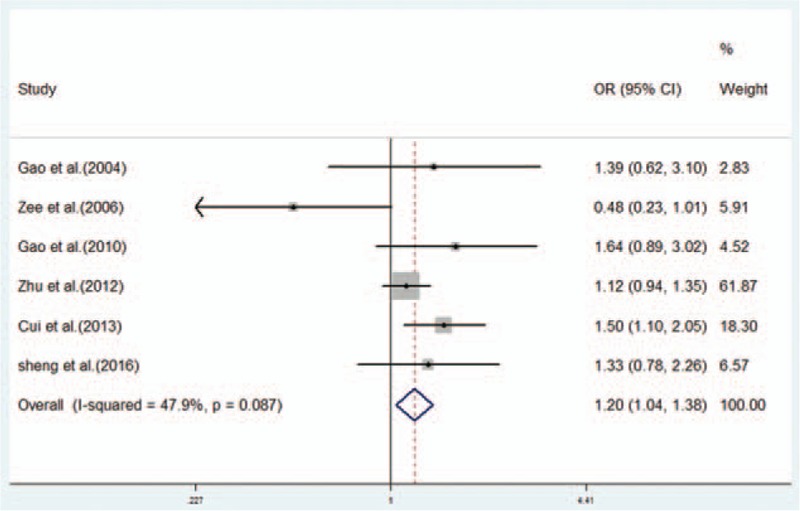
Figure 3.

Forest plot from the meta-analysis on the association between the RAGE Gly82Ser polymorphism and IS risk in dominant genetic model (GS + SS vs GG). Compared to the GG genotype, GS + SS genotypes showed an increased risk of IS. CI = confidence interval, IS = ischemic stroke, OR = odds ratio.
