Figure 2.

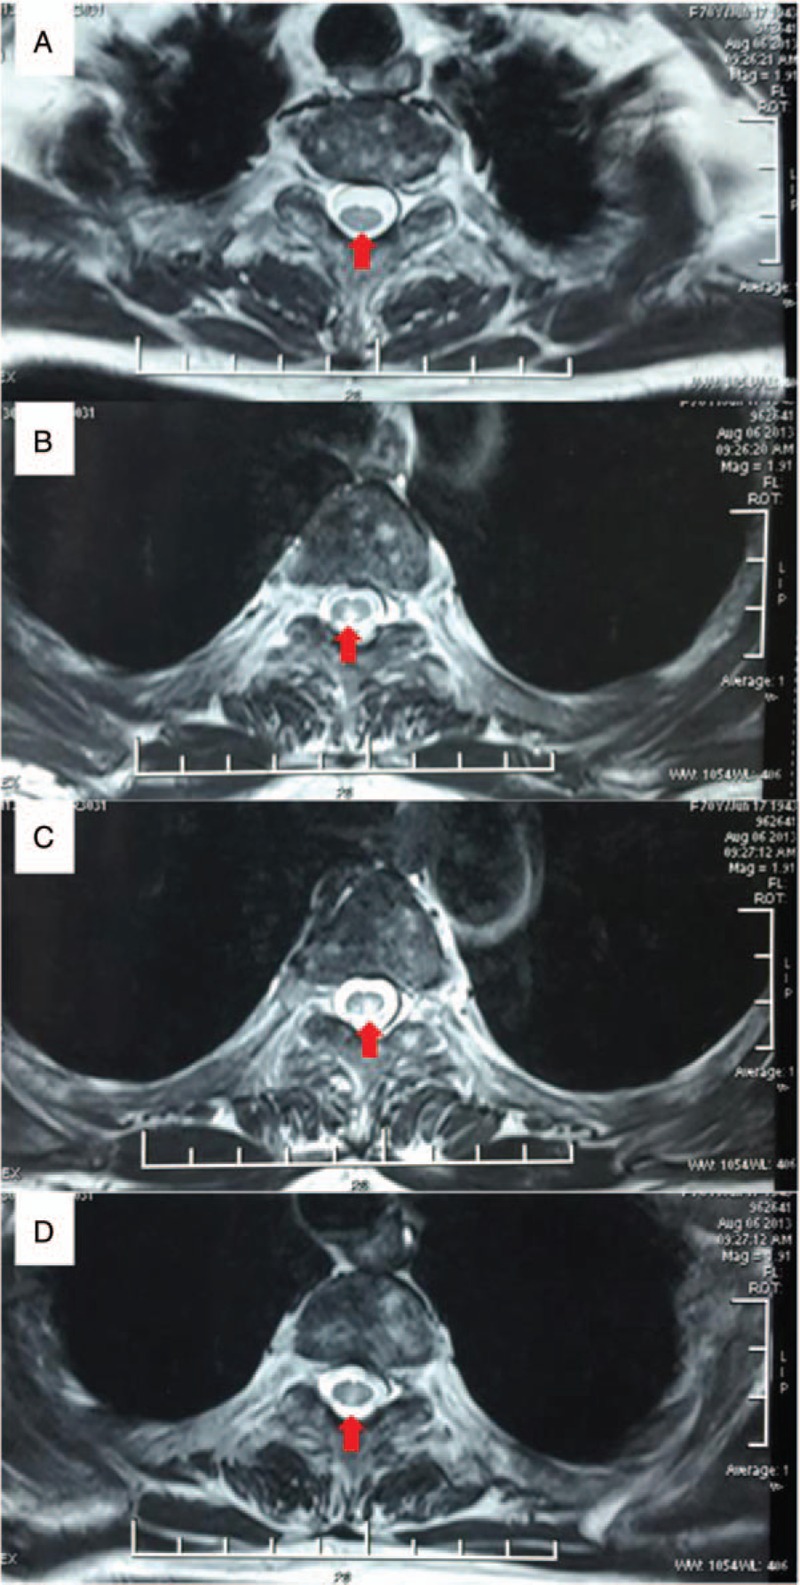
MRI of the spinal cord. MRI of spinal cord demonstrates abnormal signal intensity (red arrows) that extends from the level of the third to the sixth thoracic vertebrae in the horizontal plane.

MRI of the spinal cord. MRI of spinal cord demonstrates abnormal signal intensity (red arrows) that extends from the level of the third to the sixth thoracic vertebrae in the horizontal plane.