Abstract
To investigate the value of quantitative analysis in dual energy spectral computed tomography (DESCT) for differentiating malignant gastric mucosal lesions from benign gastric mucosal lesions (including gastric inflammation [GI] and normal gastric mucosa [NGM]). This study was approved by the ethics committee, and all patients provided written informed consent. A total of 161 consecutive patients (63 with gastric cancer [GC], 48 with GI, and 50 with NGM) who underwent dual-phase contrast enhanced DESCT scans in the arterial phase (AP) and portal venous phase (PVP) were included in this study. Iodine concentration (IC) in lesions was derived from the iodine-based material-decomposition images and normalized to that in the aorta to obtain normalized IC (nIC). The ratios of IC and nIC between the AP and PVP were calculated. Diagnostic confidence for GC and GI was evaluated with reviewing the features including gastric wall thickness, focal, and eccentric on the conventional polychromatic images. All statistical analyses were performed by using statistical software SPSS 17.0 (SPSS, Chicago, IL). IC and nIC in GC differed significantly from those in GI and NGM, except for nICAP in comparing GC with GI. Mean nIC values of GC (0.18 ± 0.06 in AP and 0.62 ± 0.16 in PVP) were significantly higher than that of NGM (0.12 ± 0.03 in AP and 0.37 ± 0.08 in PVP) (all P < 0.05). There was also significant difference for IC values in GC, GI, and NGM (24.19 ± 8.27, 19.07 ± 5.82, and 13.61 ± 2.52 mg/mL, respectively, in AP and 28.00 ± 7.01, 24.66 ± 6.55, and 16.94 ± 3.06 mg/mL, respectively, in PVP). Based on Receiver Operating Characteristic Curve analysis, nIC and IC in PVP had high sensitivities of 88.89% and 90.48%, respectively, in differentiating GC from NGM, while the sensitivities were 71.43% and 88.89% during AP. Ratios IC and nIC ratios did not provide adequate diagnostic accuracy with their area under curves less than 0.65. With the conventional features, the diagnostic accuracies for GC and GI were 75.0% and 98.0%, respectively. Quantitative analysis of DESCT imaging parameters for gastric mucosa, such as nIC and IC, is useful for differentiating malignant from benign gastric mucosal lesions.
Keywords: computed tomography, dual energy spectral imaging, gastric mucosa, monochromatic image
1. Introduction
Gastric cancer (GC) is the fourth most common cancer and the second deadly cancer in the world, and the majority occurs in the developing countries and in East Asian countries, especially in Japan, Korea, and China.[1,2] During the past 3 decades, the survival rate of GC has increased dramatically due to the early diagnosis.[3] Among the early GC patients whose lesions are limited to the gastric mucosa and submucosa, 95% patients will survive more than 5 years.[4] Consequently, early diagnosis for malignant gastric mucosal lesions is of great importance since the outcome is dependent on the initial stages.
The standard method for diagnosing GC and distinguishing it from benign gastric condition was digestive endoscopy, combined with biopsy and histopathological evaluation, which shows high diagnostic accuracy.[5] However, this method also has some shortcomings due its invasiveness. In addition, some early GCs with little contrast with the surrounding mucosa can even be missed during the routine endoscopic examination.[5,6] Also, endoscopy cannot evaluate the depth of gastric wall invasion and the distant metastatic lesions.
Multidetector computed tomography (MDCT) has in recent years become a powerful and noninvasive tool for identifying gastric wall invasion and perigastric extent in GC patients, combined with multiple planar reconstruction and virtual endoscopy, the detection rates achieved 44% to 93.5%.[7–10] However, with conventional MDCT, the averaging attenuation effect and beam-hardening artifacts would reduce the ability to reliably detect lesions, especially the small lesions, such as gastric mucosa lesions.[11] On the other hand, since the introduction in the late-2000, dual energy spectral computed tomography (DESCT) imaging, which is based on the rapid switching between 80 and 140 kVp, has gained its popularity in angiography, cancer detection, characterization, and differentiation.[12–15] The gemstone spectral imaging (GSI) mode allows the reconstruction of monochromatic images with photon energy levels from 40 to 140 keV and generates accurate material decomposition images, such as water- and iodine-based material-decomposition images. Material-decomposition images represent the amount or the density of different materials. The iodine concentration (IC) measurement in the iodine-based material decomposition image may be used to reflect the different contrast uptakes in gastric mucosa and GC, and the use of monochromatic X-ray beam in DESCT would eliminate the beam-hardening artifacts and average attenuation effects.[11,14,16,17] DESCT has demonstrated its value in gastric imaging to improve the N staging accuracy and to differentiate tumor histopathology type and lymph nodes.[16]
However, the use of DESCT imaging in gastric mucosa has not been reported. The aim of this study was to introduce a quantitative analysis method in DESCT to differentiate GC from benign gastric mucosal condition, including gastric inflammation (GI) and normal gastric mucosa (NGM).
2. Materials and methods
2.1. Patients cohort
This retrospective study was approved by our Hospital Ethics Committee (Tongji Hospital, Wuhan), and all patients provided written informed consent before the CT examinations. We retrospectively analyzed the imaging information of 161 patients who underwent dual-phase contrast enhanced CT scanning successfully with GSI mode on a Discovery CT750HD scanner (GE Medical System; Milwaukee, WI) from February 2012 to January 2013 for detecting the presence of gastric, renal, or liver lesion.
The inclusion criteria of our study were patients with GC or inflammation were histopathologically proved by surgery or by gastrointestinal endoscopy biopsy, patients had no contraindication for nonionic iodine contrast media, and patients with no chemotherapy or surgery. The interval between CT examination and biopsy or surgery was less than 1 week in GC and GI patients. Patients without any gastric symptom (such as stomach pain, nausea, abdominal distension, belching, and acid reflux, etc.), infectious diseases (such as cholecystitis and pancreatitis), or tumor history were confirmed as having NGM.
A total of 165 consecutive patients were included for CT scanning, 4 patients were excluded from the study group after the CT scanning due to heavy artifacts caused by breathing. Among the 161 patients (M:F = 75:86; age range 16–77 years with mean age 50.02 ± 15.20 years), 63 patients (M:F = 29:34) had GC (19 with early GC and 44 with advanced GC) confirmed by surgery or endoscopy, 48 patients (M:F = 26:22) had GI (21 with superficial gastritis and 27 with atrophic gastritis) confirmed by endoscopy, and 50 (M:F = 20:30) had NGM (shown in Fig. 1).
Figure 1.
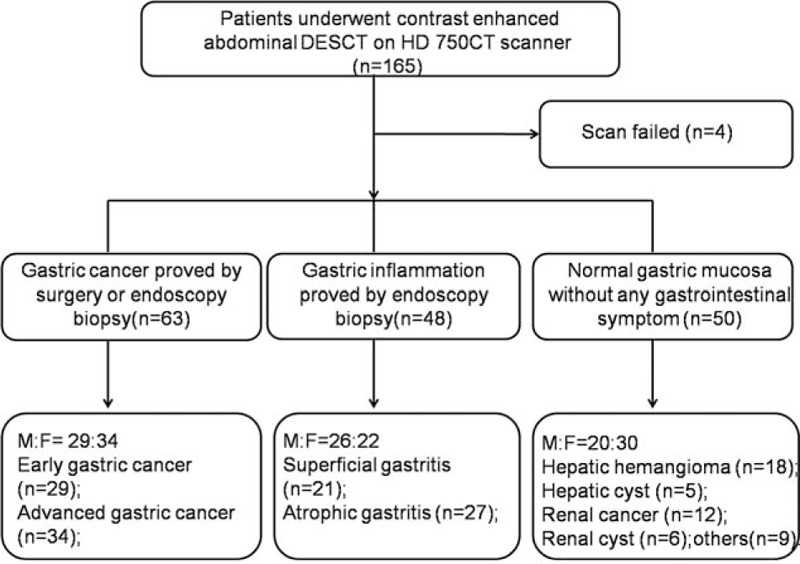
Flowchart of patient selection. DESCT = dual energy spectral computed tomography.
2.2. CT examinations
CT examinations were performed for all patients on a Discovery CT750HD scanner (GE Healthcare; Waukesha, WI). Before CT scanning, each patient orally took 800 to 1000 mL warm water in 15 to 20 minutes to achieve gastric pouch distention, then received 10 mg of butylscopolamine bromide (Buscopan, Boehringer Ingelheim; Ingelheim, Germany) intravenously through an antecubital vein to minimize bowel peristalsis and to facilitate hypotonia. Scanning covered the entire stomach region (from the top of the diaphragm to the pelvis) during a single breath-hold with patients in the supine position. Nonionic contrast material (iopromide, Ultravist 370; Schering, Berlin, Germany) was injected through an 18-gauge angiographic catheter inserted into an antecubital vein at a rate of 3 to 4 mL/s by using an automatic power injector (Stellant; Medrad, Indianola, PA), with a total dosage ranging between 60 and 100 mL (1.0 mL/kg of body weight). After the contrast material injection, 20 mL normal saline solution was injected to flush contrast material in catheter and in blood vessel.
The arterial phase (AP) scanning was performed at 30 seconds after the beginning of contrast material injection, and the portal venous phase (PVP) scan was performed at a delay of 20 seconds after finishing AP scanning. The dual-phase scanning was performed in the GSI mode with fast tube voltage switching between 80 and 140 kVp on adjacent views during a single rotation. Other scanning parameters were display field of view of 40 cm, reconstruction matrix size 512 × 512, collimation of 40 mm, slice thickness and interval for axial images of 5 mm/5 mm, tube current of 600 mA, rotation speed of 0.6 seconds, helical pitch of 0.983, and with a fixed volumetric CT dose index of 21.8 mGy for each phase. Images were reconstructed by using projection-based material-decomposition software and a standard reconstruction kernel. Two types of images were reconstructed from the single spectral CT acquisition for analysis: iodine-based material decomposition images and monochromatic images obtained at energies ranging from 40 to 140 keV. All images were reconstructed to 0.625 mm for quantitative analysis.
2.3. Imaging analysis
All DESCT data were transferred to an Advantage Workstation 4.5 (ADW 4.5) (GE Healthcare) for image analysis and data measurement.
Two experienced abdominal radiologists (5 and 9 years in abdominal imaging) manually placed circular regions of interest (ROIs) on gastric mucosa in axial 70-keV monochromatic images (slice thickness 0.625 mm) independently. Suitable ROIs were set for covering the mucosa with an area of about 1.81 mm2, avoiding cystic, necrosis, and hemorrhage, to measure imaging parameters of mucosa. All ROIs were automatically propagated to monochromatic images of all energy levels (40–140 keV) and water- and iodine-based material decomposition images. CT attenuation values were measured from the monochromatic image sets to generate a spectral hounsfield unit curve (CT number as function of photon energy), and the ICs were also calculated automatically.
Each reader placed the ROIs in 3 neighboring areas on mucosa, the average of the 2 readers was the final value. To minimize the variations between patients, the IC of mucosa was normalized to the IC of aorta both for AP and PVP with a suitable ROI as large as possible in the same level to derive a normalized IC (nIC) with formula: nIC = IClesion/ICaorta. IC and nIC ratios were calculated with the formulas: IC ratio = ICPVP/ICAP, nIC ratio = nICPVP/nICAP (ICPVP and ICAP values were IC in PVP and AP, respectively, and nICPVP and nICAP were nIC values in PVP and AP, respectively).
Four experienced abdominal radiologists (above 5 years) reviewed the GC and GI conventional polychromatic images at the workstation. They were blinded to the diagnosis of the lesions, patient's information, and symptom. The readers measured the gastric wall thickness on the balanced lesions and reviewed the following features including the gastric wall thickness, eccentric, and focal on the conventional polychromatic images. According to the features above, the images were scored as levels 1—carcinoma, 0—unidentified, and −1—inflammation both for GC and GI groups. When the view was inconsistent, the decision was made with discussion by these 4 radiologists.
2.4. Statistical analysis
All statistical analyses were performed using SPSS 17.0 (SPSS, Chicago, IL) statistical software for Windows. All quantitative data were presented as mean ± standard deviation. The one-way analysis of variance test with post hoc Bonferroni correction was performed to compare the parameters IC, nIC, IC ratio, and nIC ratio between GC and GI, GC and NGM, and GI and NGM both in AP and PVP, with P < 0.05 indicating statistical significance. Receiver operating characteristic curve (ROC) analysis was performed to calculate the diagnostic accuracy of IC, nIC, IC ratio, and nIC ratio and to establish the optimal threshold values to discriminating GC from NGM and GI. Area under curve (AUC) for the ROC curve, sensitivity, specificity, and cutoff value were calculated. The null hypothesis tested was that the AUC was 0.5, and the alternative was that the AUC was greater than 0.5.
Diagnostic accuracy was analyzed with the diagnostic confidence and the clinical results (including pathological and endoscopic results). The interobserver agreement for the gastric lesions and aorta IC measurement was calculated with the interclass correlation coefficient (ICC). The interobserver agreement was defined as almost perfect (0.81–1.00), substantial (0.61–0.80), moderate (0.41–0.60), fair (0.21–0.40), slight (0.00–0.20), and poor (<0.00).[18]
3. Results
Values of nIC, IC, IC ratio, and nIC ratio for GC, GI, and NGM in both AP and PVP for the spectral CT quantitative assessment are listed in Table 1. The quantitative parameters for the 3 groups were compared with each other. IC and nIC values in patients with GC were significantly different from those in patients with GI and NGM, except for nICAP in comparing GC with GI. Mean nIC of GC in AP (0.18 ± 0.06) was higher than that of GI (0.16 ± 0.05) without significant difference while was significantly higher than that of NGM (0.12 ± 0.03), and nIC of GC in PVP (0.62 ± 0.16) was significantly higher than that of GI (0.54 ± 0.15) and NGM (0.37 ± 0.08) (P < 0.01). There was also significant difference for IC values in GC, GI, and NGM (24.19 ± 8.27, 19.07 ± 5.82, and 13.61 ± 2.52 mg/mL, respectively, in AP and 28.00 ± 7.0182, 24.66 ± 6.5582, and 16.94 ± 3.0682 mg/mL, respectively, in PVP). The nIC ratio of GC (3.72 ± 1.23) and GI (3.69 ± 1.35) was higher than that of NGM (3.20 ± 1.08), but there was no difference between each other. For IC ratio, there was no significant difference among GC, GI, and NGM (P > 0.05) (showed in Figs. 2–4).
Table 1.
Spectral computed tomography quantitative assessment of GC and gastric inflammation in gastric mucosa and normal gastric mucosa.

Figure 2.
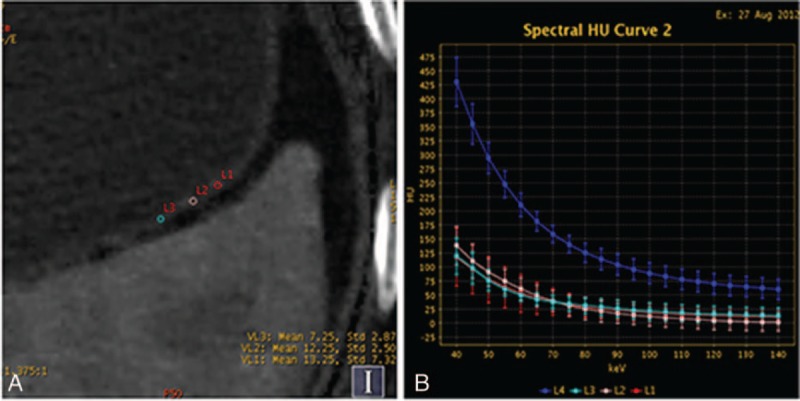
Contrast enhanced images of a 60-year-old man with a right renal cyst show the iodine concentration (IC), regions of interests (ROIs), computed tomography attenuation, and spectral curve with normal gastric mucosa. (A) Iodine-based material-decomposition image at 70 keV with ROI setting on partial enlarged views during portal venous phase (PVP) and showed that IC of NGM was 13 mg/mL and normalized IC was 0.272. (B) Graph showed spectral HU curves of aorta (blue) and NGM (the other 3 colors) during PVP.
Figure 4.
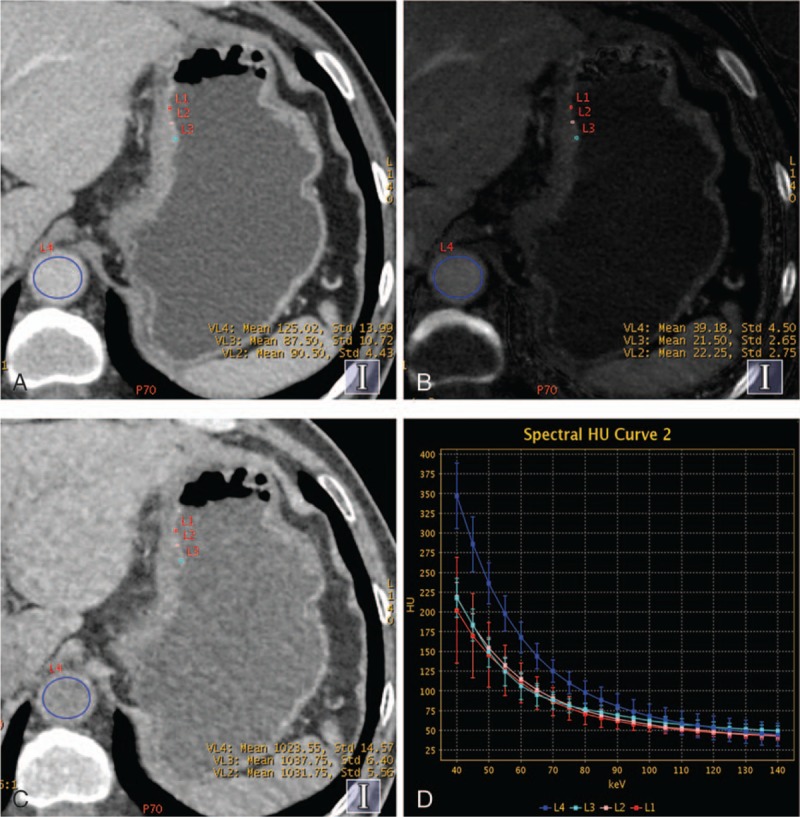
Contrast enhanced gemstone spectral imaging images from a 59-year-old man with undifferentiated adenocarcinoma staged T4 in the lesser curvature of gastric in portal venous phase (PVP). (A) Monochromatic image at 70 keV during PVP showed the thickened gastric wall. (B) Iodine-based material-decomposition image showed that the iodine concentration of gastric cancer mucosa was 21.6 mg/mL, and the normalized iodine concentration was 0.55. (C) Water-based material-decomposition image. (D) Graph showed spectral HU curves of aorta (blue) and the mucosa of gastric cancer mucosa (the other 3 colors) during PVP.
Figure 3.
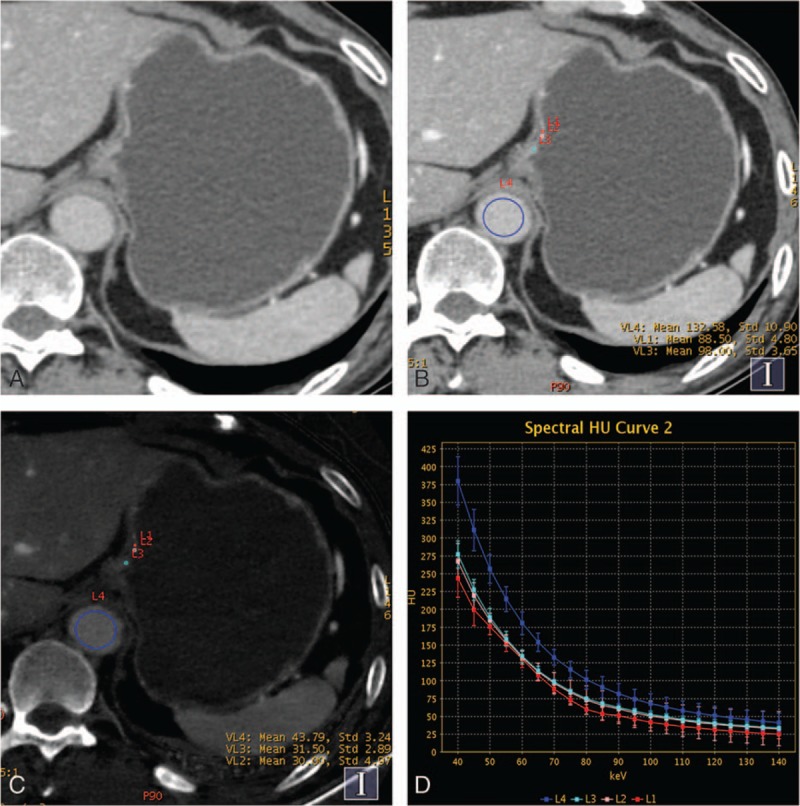
Contrast enhanced gemstone spectral imaging images of a 61-year-old man with early gastric adenocarcinoma (staged T1) demonstrated focal thickening and focalized mucosa absent in the gastric cardia during portal venous phase (PVP). (A and B) Monochromatic image at 70 keV in PVP showed the focalized mucosa absent and location of the regions of interests. (C) Iodine-based material-decomposition image showed that iodine concentration of gastric cancer mucosa was 29.1 mg/mL and normalized iodine concentration was 0.67. (D) Graph showed spectral HU curves of aorta (blue) and the mucosa of gastric cancer mucosa (the other 3 colors) during the PVP.
The ROC curves for different parameters in DESCT in differentiating GC from GI and NGM during AP and PVP are shown in Fig. 5. The parameter cutoff values required to optimize both the sensitivity and specificity for distinguishing the 2 types of mucosa are also listed. Based on the ROC analysis, nIC and IC in PVP had high sensitivity of 88.89% and 90.48% in differentiating GC from NGM, respectively, and the values were 71.43% and 88.89% during AP. For differentiating GI from NGM, using a threshold of 0.45 for nIC in PVP would provide sensitivity of 72.92% and specificity of 86.00% with AUC of 0.86, while using a threshold of 22.25 mg/mL for IC in PVP would provide sensitivity of 68.75% and specificity of 96.00% with AUC of 0.86. However, both the IC and nIC ratios did not show strong evidence for diagnosing the gastric mucosa lesions, with all of the AUCs less than 0.65 (showed in Table 2).
Figure 5.
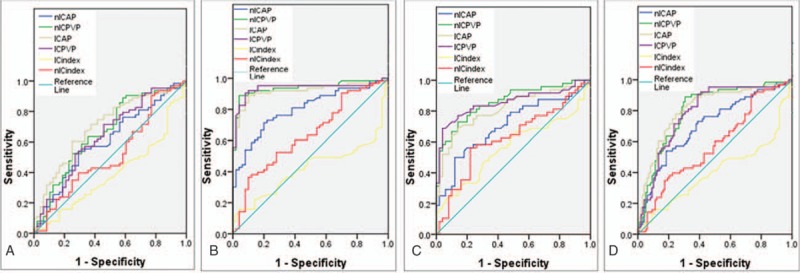
ROC curves for spectral computed tomography parameters (included iodine concentration [IC], normalized IC [nIC], IC ratio, and nIC ratio) during arterial phase and portal venous phase of the gastric mucosa in distinguishing (A) gastric cancer (GC) from gastric inflammation (GI), (B) GC from normal gastric mucosa (NGM), (C) GI from NGM, and (D) GC from benign gastric mucosa (GI and NGM included).
Table 2.
Diagnostic performance of spectral computed tomography quantitative parameters for discriminating GC from GI and NGM.

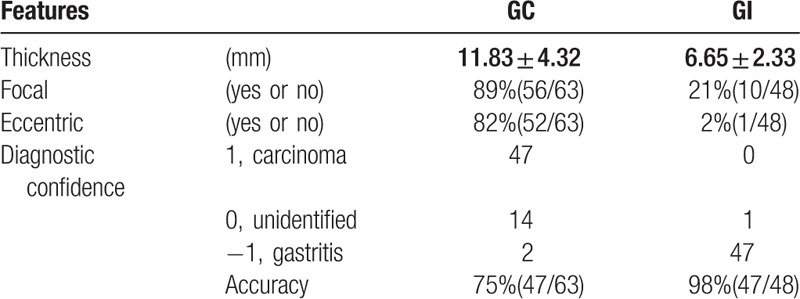
The thickness of gastric carcinoma (11.83 ± 4.32 mm) was significantly higher than that of gastritis (6.65 ± 2.33 mm) (P < 0.01). In gastric carcinoma, the occurrence rate of focal and eccentric sign was higher than that of gastritis. With the features on the conventional polychromatic images, the diagnostic accuracies for GC and GI were 75% (47/63) and 98% (47/48), respectively (showed in Table 3). The interobserver agreement for the IC measurement between these 4 readers was almost perfect with all ICCs above 0.9.
Table 3.
Features on the conventional images and diagnostic accuracy for GC and GI.
4. Discussion
In this study, we investigated the use of nontraditional CT quantitative parameters (such as IC) in DESCT for differentiating malignant gastric mucosal lesions from benign gastric mucosal lesions (including GI and NGM). For medical diagnostic imaging with GSI scanning mode, water and iodine were often selected as the basis material pairs for material-decomposition image presentation because their atomic numbers span the range of atomic numbers for materials generally found in medical imaging and approximate those of soft tissue and iodinated contrast material to result in material-attenuation images that were intuitive to interpret.[11,14] For GC and GI in the mucosa and NGM, their IC values were derived from the iodine-based material decomposition images.
The quantitative parameter IC could be used to effectively reflect the degree of enhancement and the blood supply of lesions.[14] Our result showed that IC of GC was significantly higher than that of NGM both in AP and PVP. The increased IC value in GC would indicate the increased angiogenesis in the development of tumors, since the angiogenesis is the fundamental process and the growth formation would determine their enhancement in CT.[19] ROC analysis in this study indicated that IC had high sensitivity and specificity for discriminating GC from NGM. In PVP, a threshold of 21.17 mg/mL for IC in PVP would yield a sensitivity of 90.48% and specificity of 92.0% for differentiating GC from NGM. On the other hand, the inflammatory lesions are also associated with increased angiogenesis, which will result in similar effects to tumor-associated neovascularization.[19] Our study revealed that even though there was no statistically significant difference in the IC value between GC and GI, and the AUC values were not high enough to provide clinically meaningful diagnostic power to differentiate GC from GI. On the other hand, using IC in PVP, we were able to obtain AUC of 0.86 with sensitivity of 68.75% and specificity of 96% for the differentiation of GI from NGM.
Since simple measurements of IC within tissues might be influenced by patient variations in height, weight, cardiac output, and central blood volume, we also calculated the nIC, which uses the IC of aorta as the reference parameter to minimize the variations in patients.[11,20] The nICs during the PVP provided high sensitivity for diagnosing GC from NGM. In PVP, nIC of GC was significantly higher than that of NGM, and a threshold for nIC of 0.48 yielded a high sensitivity of 88.89% and specificity of 96.00% for differentiating GC from NGM, and the AUC reached 0.94. Our results are consistent with many other clinical applications in that the quantitative nIC measurement was proven to be valuable, such as differentiating hepatic lesions, evaluating lymph nodes in rectal cancer and papillary thyroid cancer, and distinguishing between differentiated and undifferentiated GCs.[11,14,16,18,21] On the other hand, results indicated that the nIC ratio (including IC ratio) had no diagnostic value for discriminating GC from GI and NGM.
In general, we found that values in PVP provided higher diagnostic power than that in AP. Using nIC in AP, the sensitivity and specificity were only 71.43% and 80.00%, respectively, with an AUC of 0.80 for differentiating GC from NGM. The AUCs in PVP were higher than in AP for other group pairs. Some authors[11,15] reported that measuring ICs in PVP could increase the accuracy for distinguishing small hepatocellular carcinoma from other hepatic lesions than in AP, due to the fact that contrast could effectively disperse in the liver and tissue in PVP. Combing the conventional size criterion, the nIC of lymph nodes during the PVP would improve the diagnostic accuracy for distinguishing metastatic from nonmetastatic lymph nodes in rectal cancer due to the contrast media both in intrasvasular and extravascular space with the leakage to the extravascular space.[18]
In this study, the nIC of GC was higher than that of GI with a high sensitivity, while with a low specificity (41.67%). Gastric carcinoma originated from the mucosa and the sequence was from chronic nonatrophic gastritis that progressed to chronic atrophic gastritis, which might lead to intestinal metaplasia, dysplasia, and finally adenocarcinoma.[4] In addition, there is increasing evidence that the inflammation seems to play a critical role in the development and progression of numerous cancers.[22,23] The main reaction of inflammation is the increased blood flow secondary to vasodilation and increased vascular permeability, which would lead to more IC in the gastric mucosa in enhanced CT.[14,19,22] Insko et al[24]summarized taking advantage of the gastric wall thickness was 1 cm or greater, focal, eccentric, and gastric wall enhanced almost would reach a 92% specificity for indicating malignant lesions, while with a low sensitivity. So taking these features into account, the diagnostic accuracy for GI has reached 98%. In the clinical study, combing the quantitative analysis and conventional features would provide more diagnostic information.
Our study did have some limitations. First, the patients of NGM group were confirmed by clinical information, and not all NGM patients were confirmed by pathological or endoscopy, the normal group might have slight gastritis which may lead to some bias in the study. Second, in this study, we focused our attention on the quantitative analysis of the IC of gastric mucosa without the evaluation of N staging. The use of optimal monochromatic images in spectral CT imaging could improve the N staging accuracy for GCs which was the key for choosing accurate therapy.[16] Third, in this study, few patients of early GC had lesion localized in mucosa layer, the result should be verified in large-scale clinical study. Fourth, we did not divide the GC patients into different pathological pattern groups. In the following study, we will consider the diversity outcome from different mucosa pathological patterns. Finally, the thickness of gastric mucosa was just 2 to 3 mm, which made it difficult to place ROIs.
In conclusion, quantitative analysis of spectral CT parameters may be used to improve the sensitivity and specificity for differentiating malignant mucosa from benign gastric mucosa with DESCT, especially in PVP.
Footnotes
Abbreviations: AP = arterial phase, DESCT = dual energy spectral computed tomography, GC = gastric cancer, GI = gastric inflammation, GSI = gemstone spectral imaging, IC = iodine concentration, NGM = normal gastric mucosa, nIC = normalized IC, PVP = portal venous phase.
Funding/support: Contract grant sponsor—National Natural Science Foundation of China; contract grant number: 81271529; Contract grant number—81371524.
The authors have no conflicts of interest to disclose.
References
- [1].Ferlay J, Shin HR, Bray F, et al. Estimates of worldwide burden of cancer in 2008: GLOBOCAN 2008. Int J Cancer 2010;127:2893–917. [DOI] [PubMed] [Google Scholar]
- [2].Jemal A, Bray F, Center MM, et al. Global cancer statistics. CA Cancer J Clin 2011;61:69–90. [DOI] [PubMed] [Google Scholar]
- [3].Crew KD, Neugut AI. Epidemiology of gastric cancer. World J Gastroenterol 2006;12:354–62. [DOI] [PMC free article] [PubMed] [Google Scholar]
- [4].Adamu MA, Weck MN, Gao L, et al. Incidence of chronic atrophic gastritis: systematic review and meta-analysis of follow-up studies. Eur J Epidemiol 2010;25:439–48. [DOI] [PubMed] [Google Scholar]
- [5].Xu ZQ, Broza YY, Ionsecu R, et al. A nanomaterial-based breath test for distinguishing gastric cancer from benign gastric conditions. Br J Cancer 2013;108:941–50. [DOI] [PMC free article] [PubMed] [Google Scholar]
- [6].Verdecchia A, Francisci S, Brenner H, et al. Recent cancer survival in Europe: a 2000-02 period analysis of EUROCARE-4 data. Lancet Oncol 2007;8:784–96. [DOI] [PubMed] [Google Scholar]
- [7].Chen CY, Hsu JS, Wu DC, et al. Gastric cancer: preoperative local staging with 3D multi-detector row CT—correlation with surgical and histopathologic results. Radiology 2007;242:472–82. [DOI] [PubMed] [Google Scholar]
- [8].Kim JH, Eun HW, Choi JH, et al. Diagnostic performance of virtual gastroscopy using MDCT in early gastric cancer compared with 2D axial CT: focusing on interobserver variation. AJR Am J Roentgenol 2007;189:299–305. [DOI] [PubMed] [Google Scholar]
- [9].Lee IJ, Lee JM, Kim SH, et al. Diagnostic performance of 64-channel multidetector CT in the evaluation of gastric cancer: Differentiation of mucosal cancer (T1a) from submucosal involvement (T1b and T2). Radiology 2010;255:805–14. [DOI] [PubMed] [Google Scholar]
- [10].Shen Y, Kang HK, Jeong YY, et al. Evaluation of early gastric cancer at multidetector CT with multiplanar reformation and virtual endoscopy. Radiographics 2011;31:189–99. [DOI] [PubMed] [Google Scholar]
- [11].Lv P, Lin XZ, Li J, et al. Differentiation of small hepatic hemangioma from small hepatocellular carcinoma: recently introduced spectral CT method. Radiology 2011;259:720–9. [DOI] [PubMed] [Google Scholar]
- [12].Hu S, Huang W, Chen Y, et al. Spectral CT evaluation of interstitial brachytherapy in pancreatic carcinoma xenografts: Preliminary animal experience. Eur Radiol 2014;24:2167–73. [DOI] [PubMed] [Google Scholar]
- [13].Wan Y, Li Z, Ji N, et al. Comparison of gastric vascular anatomy by monochromatic and polychromatic dual-energy spectral computed tomography imaging. J Int Med Res 2014;42:26–34. [DOI] [PubMed] [Google Scholar]
- [14].Yu Y, Guo L, Hu C, et al. Spectral CT imaging in the differential diagnosis of necrotic hepatocellular carcinoma and hepatic abscess. Clin Radiol 2014. [DOI] [PubMed] [Google Scholar]
- [15].Wang Q, Shi G, Qi X, et al. Quantitative analysis of the dual-energy CT virtual spectral curve for focal liver lesions characterization. Eur J Radiol 2014;83:1759–64. [DOI] [PubMed] [Google Scholar]
- [16].Pan Z, Pang L, Ding B, et al. Gastric cancer staging with dual energy spectral CT imaging. PLoS One 2013;8:e53651. [DOI] [PMC free article] [PubMed] [Google Scholar]
- [17].Boll DT, Patil NA, Paulson EK, et al. Focal cystic high-attenuation lesions: characterization in renal phantom by using photon-counting spectral CT – improved differentiation of lesion composition. Radiology 2010;254:270–6. [DOI] [PubMed] [Google Scholar]
- [18].Liu H, Yan F, Pan Z, et al. Evaluation of dual energy spectral CT in differentiating metastatic from non-metastatic lymph nodes in rectal cancer: initial experience. Eur J Radiol 2015;84:228–34. [DOI] [PubMed] [Google Scholar]
- [19].Miles KA. Tumour angiogenesis and its relation to contrast enhancement on computed tomography: a review. Eur J Radiol 1999;30:198–205. [DOI] [PubMed] [Google Scholar]
- [20].Yu Y, He N, Sun K, et al. Differentiating hepatocellular carcinoma from angiomyolipoma of the liver with CT spectral imaging: a preliminary study. Clin Radiol 2013;68:e491–7. [DOI] [PubMed] [Google Scholar]
- [21].Liu X, Ouyang D, Li H, et al. Papillary thyroid cancer: dual-energy spectral CT quantitative parameters for preoperative diagnosis of metastasis to the cervical lymph nodes. Radiology 2015;275:167–76. [DOI] [PubMed] [Google Scholar]
- [22].Jeong J, Lim SM, Yun JY, et al. Comparison of two inflammation-based prognostic scores in patients with unresectable advanced gastric cancer. Oncology-Basel 2012;83:292–9. [DOI] [PubMed] [Google Scholar]
- [23].Chang W. Inflammation-related factors predicting prognosis of gastric cancer. World J Gastroenterol 2014;20:4586. [DOI] [PMC free article] [PubMed] [Google Scholar]
- [24].Insko EK, Levine MS, Birnbaum BA, et al. Benign and malignant lesions of the stomach: evaluation of CT criteria for differentiation. Radiology 2003;228:166–71. [DOI] [PubMed] [Google Scholar]


