
Figure 5.
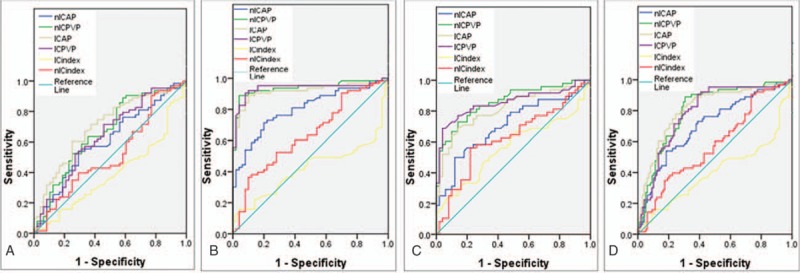
ROC curves for spectral computed tomography parameters (included iodine concentration [IC], normalized IC [nIC], IC ratio, and nIC ratio) during arterial phase and portal venous phase of the gastric mucosa in distinguishing (A) gastric cancer (GC) from gastric inflammation (GI), (B) GC from normal gastric mucosa (NGM), (C) GI from NGM, and (D) GC from benign gastric mucosa (GI and NGM included).