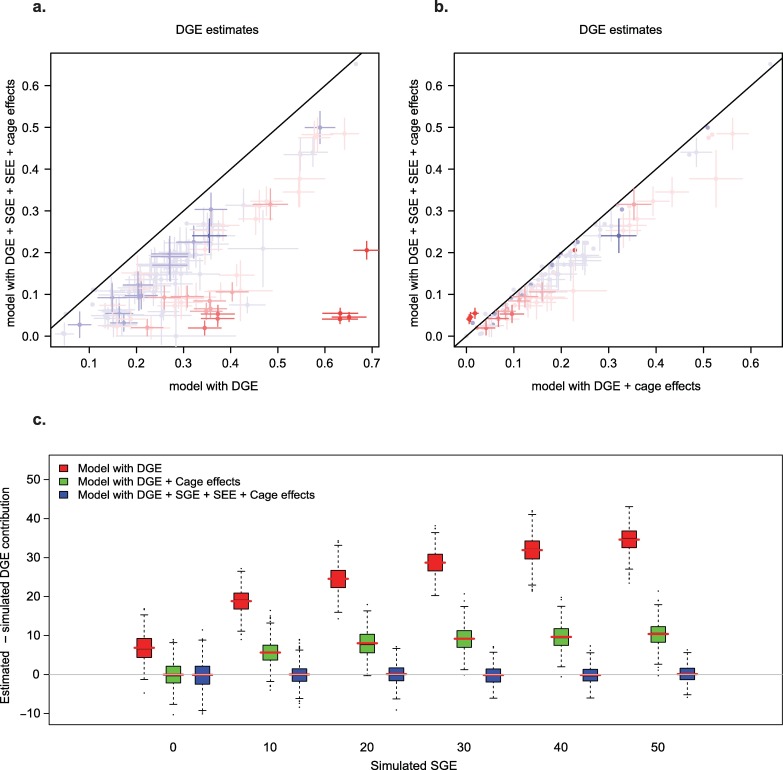
Fig 2. Ignoring SGE leads to biased estimates of DGE (heritability) in the outbred mice dataset.
(A,B) DGE estimates for all organismal phenotypes. The colour of the dots indicates the sign of the covariance between DGE and SGE (blue: negative; red: positive; see Methods); the intensity of the colour indicates the magnitude of SGE. (A) Comparison of DGE estimates from model with DGE only (x-axis) and full model with DGE, SGE, (y-axis). (B) Comparison of DGE estimates from model with DGE and cage effects (x-axis) and full model (y-axis). (C) Difference between estimated and simulated DGE. The contribution of SGE to simulated phenotypes varied and is shown on the x-axis. See Methods for values given to other parameters. Simulations were analyzed with three different models: DGE only (red), DGE + cage effects (green), DGE + SGE + cage effects + social environmental effects (blue).

