
Fig 3. Expression of Pgc-1α and PPARs in aortic extracts of LDL-receptor deficient and placebo DKO and caloric-restricted DKO mice.
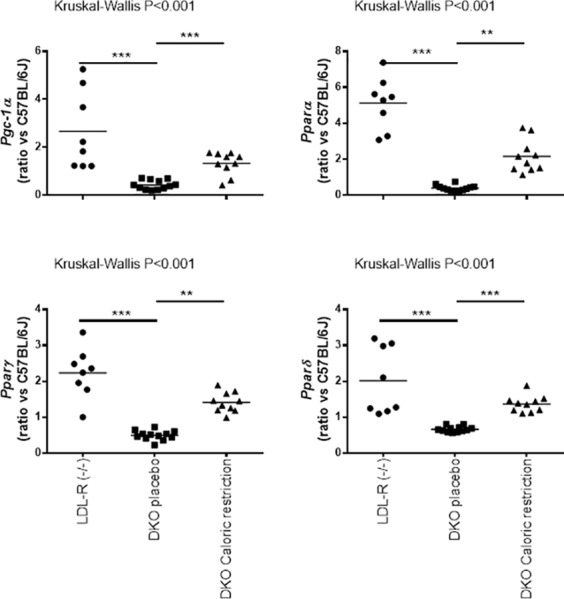
Scatter plots show expression of Pgc-1α, Pparα, Pparγ and Pparδ in LDL-receptor (n = 8), placebo DKO (n = 12) and caloric-restricted DKO mice (n = 10). Gene expression data are ratios compared to expressions in aortic extracts of 10 C57BL/6J mice. **p<0.01 and ***p<0.001 compared to placebo DKO mice.